c5n.9xlarge by Amazon Web Services
Geekbench is a cross-platform processor benchmark with a scoring system that determines single-core and multi-core performance using loads simulating real-world scenarios. Geekbench 5 score is calculated with a reference score of 2500 representing the performance of the Intel Core i5-2520M @ 2.50 GHz. The software benchmark is available for Mac OS, Windows, Linux, Android and iOS platforms.
Specifications:
CPU
36
RAM
96.0 GB
Net
50000 Mbps
{
"configuration": {
"chart": {
"type": "scatter",
"polar": false,
"zoomType": "",
"options3d": {},
"height": null,
"width": null,
"margin": null,
"inverted": false,
"zooming": {}
},
"credits": {
"enabled": false
},
"title": {
"text": ""
},
"colorAxis": null,
"subtitle": {
"text": ""
},
"xAxis": {
"title": {
"text": [
"Single Score"
],
"useHTML": false,
"style": {
"color": "#666666"
}
},
"categories": null,
"lineWidth": 1,
"tickInterval": null,
"tickWidth": 1,
"tickLength": 10,
"tickPixelInterval": 100,
"plotLines": null,
"labels": {
"enabled": true,
"format": null,
"formatter": "",
"style": {
"color": "#666666",
"cursor": "default",
"fontSize": "11px"
},
"useHTML": false,
"step": 0
},
"plotBands": null,
"visible": true,
"floor": null,
"ceiling": null,
"type": "linear",
"min": 0,
"gridLineWidth": 1,
"gridLineColor": "#e6e6e6",
"minorTickInterval": null,
"minorTickWidth": 0,
"minTickInterval": null,
"startOnTick": true,
"endOnTick": true,
"tickmarkPlacement": 100,
"units": 100,
"minRange": 100
},
"yAxis": {
"title": {
"text": [
"Multi Score"
],
"useHTML": false,
"style": {
"color": "#666666"
}
},
"categories": null,
"plotLines": null,
"plotBands": null,
"lineWidth": null,
"tickInterval": null,
"tickLength": 10,
"floor": null,
"ceiling": null,
"gridLineInterpolation": null,
"gridLineWidth": 1,
"gridLineColor": "#e6e6e6",
"min": 0,
"max": null,
"minorTickInterval": null,
"minorTickWidth": 0,
"minTickInterval": null,
"startOnTick": true,
"endOnTick": true,
"minRange": null,
"type": "linear",
"tickmarkPlacement": null,
"labels": {
"enabled": true,
"formatter": null,
"style": {
"color": "#666666",
"cursor": "default",
"fontSize": "11px"
},
"useHTML": false
}
},
"zAxis": {
"title": {
"text": "Multi Score"
}
},
"plotOptions": {
"series": {
"dataLabels": {
"enabled": false,
"format": null,
"distance": 30,
"align": "center",
"inside": null,
"allowOverlap": false,
"style": {
"fontSize": "11px"
}
},
"showInLegend": null,
"turboThreshold": 0,
"stacking": "",
"groupPadding": 0.2,
"centerInCategory": false,
"findNearestPointBy": "x"
}
},
"navigator": {
"enabled": false
},
"scrollbar": {
"enabled": false
},
"rangeSelector": {
"enabled": false,
"inputEnabled": false
},
"legend": {
"enabled": null,
"maxHeight": null,
"align": "center",
"verticalAlign": "bottom",
"layout": "horizontal",
"width": null,
"margin": 12,
"reversed": false
},
"series": [
{
"name": "c5n.9xlarge by Amazon Web Services",
"color": "#f7981d",
"data": [
{
"x": 977.3647299528415,
"y": 16878.570059736074
},
{
"x": 981.1919008957034,
"y": 16811.47392527171
},
{
"x": 982.8168411718273,
"y": 16813.425667563744
},
{
"x": 978.6345742835073,
"y": 16699.40478171374
},
{
"x": 977.8873787400925,
"y": 16836.87584870725
},
{
"x": 982.2919440090545,
"y": 16817.47966945516
},
{
"x": 980.1293743662904,
"y": 16791.228201980608
},
{
"x": 981.9876773832452,
"y": 16764.799988892217
},
{
"x": 977.4011029469939,
"y": 16736.14160622583
},
{
"x": 977.853430124325,
"y": 16787.612517952548
},
{
"x": 983.1053637608184,
"y": 16756.009750319015
},
{
"x": 979.5222935649688,
"y": 16757.273165393388
},
{
"x": 978.4570001087906,
"y": 16765.2951800771
},
{
"x": 981.7114760213619,
"y": 16794.064027485772
},
{
"x": 981.4408357752841,
"y": 16788.623219267003
},
{
"x": 976.4953065152031,
"y": 16825.404970300933
},
{
"x": 979.4266012238838,
"y": 16856.162873641893
},
{
"x": 980.3175495956423,
"y": 16821.870833877212
},
{
"x": 981.3135450109708,
"y": 16795.028850178103
},
{
"x": 982.4581394579868,
"y": 16812.770876910894
},
{
"x": 978.3354344194967,
"y": 16747.54096051523
},
{
"x": 981.8715658941755,
"y": 16801.858889199728
},
{
"x": 983.0561368896094,
"y": 16770.60899253198
},
{
"x": 977.4095359216617,
"y": 16756.67682940556
},
{
"x": 977.3597164640014,
"y": 16821.080813086082
},
{
"x": 983.3593138279941,
"y": 16799.93617658894
},
{
"x": 983.240848349509,
"y": 16862.15781501715
},
{
"x": 982.5218265803685,
"y": 16746.660995062564
},
{
"x": 982.7029971569345,
"y": 16870.164904986
},
{
"x": 980.4340909467057,
"y": 16764.132494739635
},
{
"x": 982.5246710766208,
"y": 16782.438929168686
},
{
"x": 976.7898131242667,
"y": 16733.912652222247
},
{
"x": 981.3514765606637,
"y": 16800.507101273754
},
{
"x": 982.0423689965148,
"y": 16759.56882323248
},
{
"x": 983.6333142960041,
"y": 16788.137934121074
},
{
"x": 976.6060244772611,
"y": 16833.85617374677
},
{
"x": 983.2435210667277,
"y": 16865.151900174897
},
{
"x": 977.4067894510401,
"y": 16783.741345965398
},
{
"x": 983.0703121105989,
"y": 16800.78219442116
},
{
"x": 978.7929583106622,
"y": 16733.68639698182
}
]
}
],
"drilldown": {},
"tooltip": {
"enabled": true,
"useHTML": false,
"format": null,
"headerFormat": "",
"pointFormat": "<span style=\"color:{series.color}\">Single</span>: <b>{point.x:.0f}</b><br><span style=\"color:{series.color}\">Multi</span>: <b>{point.y:.0f}</b>",
"footerFormat": "",
"shared": false,
"outside": false,
"valueDecimals": null,
"split": false
},
"annotations": null
},
"hc_type": "chart",
"id": "203400271560168563850587986855436614302"
}
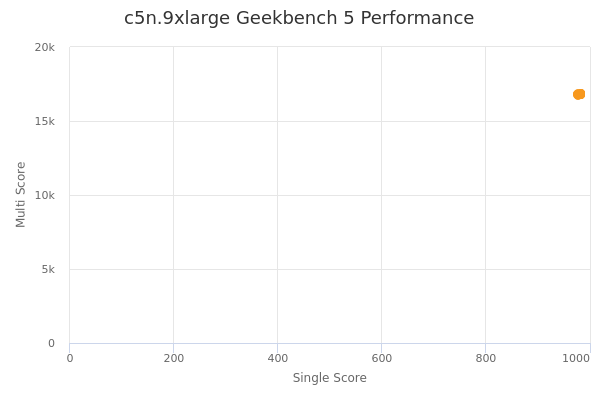
| Single | Multi | |
|---|---|---|
| Max | 984 | 16879 |
| Average | 980 | 16793 |
| Deviation | 2.31 | 40.92 |
| Min | 976 | 16699 |
Sign up as Freemium to get more insight.
- In same series
- c5n.large
- c5n.xlarge
- c5n.2xlarge
- c5n.4xlarge
- c5n.9xlarge
- c5n.18xlarge
- c5n.metal