c5n.metal by Amazon Web Services
Geekbench is a cross-platform processor benchmark with a scoring system that determines single-core and multi-core performance using loads simulating real-world scenarios. Geekbench 5 score is calculated with a reference score of 2500 representing the performance of the Intel Core i5-2520M @ 2.50 GHz. The software benchmark is available for Mac OS, Windows, Linux, Android and iOS platforms.
Specifications:
CPU
72
RAM
192.0 GB
Net
100000 Mbps
{
"configuration": {
"chart": {
"type": "scatter",
"polar": false,
"zoomType": "",
"options3d": {},
"height": null,
"width": null,
"margin": null,
"inverted": false,
"zooming": {}
},
"credits": {
"enabled": false
},
"title": {
"text": ""
},
"colorAxis": null,
"subtitle": {
"text": ""
},
"xAxis": {
"title": {
"text": [
"Single Score"
],
"useHTML": false,
"style": {
"color": "#666666"
}
},
"categories": null,
"lineWidth": 1,
"tickInterval": null,
"tickWidth": 1,
"tickLength": 10,
"tickPixelInterval": 100,
"plotLines": null,
"labels": {
"enabled": true,
"format": null,
"formatter": "",
"style": {
"color": "#666666",
"cursor": "default",
"fontSize": "11px"
},
"useHTML": false,
"step": 0
},
"plotBands": null,
"visible": true,
"floor": null,
"ceiling": null,
"type": "linear",
"min": 0,
"gridLineWidth": 1,
"gridLineColor": "#e6e6e6",
"minorTickInterval": null,
"minorTickWidth": 0,
"minTickInterval": null,
"startOnTick": true,
"endOnTick": true,
"tickmarkPlacement": 100,
"units": 100,
"minRange": 100
},
"yAxis": {
"title": {
"text": [
"Multi Score"
],
"useHTML": false,
"style": {
"color": "#666666"
}
},
"categories": null,
"plotLines": null,
"plotBands": null,
"lineWidth": null,
"tickInterval": null,
"tickLength": 10,
"floor": null,
"ceiling": null,
"gridLineInterpolation": null,
"gridLineWidth": 1,
"gridLineColor": "#e6e6e6",
"min": 0,
"max": null,
"minorTickInterval": null,
"minorTickWidth": 0,
"minTickInterval": null,
"startOnTick": true,
"endOnTick": true,
"minRange": null,
"type": "linear",
"tickmarkPlacement": null,
"labels": {
"enabled": true,
"formatter": null,
"style": {
"color": "#666666",
"cursor": "default",
"fontSize": "11px"
},
"useHTML": false
}
},
"zAxis": {
"title": {
"text": "Multi Score"
}
},
"plotOptions": {
"series": {
"dataLabels": {
"enabled": false,
"format": null,
"distance": 30,
"align": "center",
"inside": null,
"allowOverlap": false,
"style": {
"fontSize": "11px"
}
},
"showInLegend": null,
"turboThreshold": 0,
"stacking": "",
"groupPadding": 0.2,
"centerInCategory": false,
"findNearestPointBy": "x"
}
},
"navigator": {
"enabled": false
},
"scrollbar": {
"enabled": false
},
"rangeSelector": {
"enabled": false,
"inputEnabled": false
},
"legend": {
"enabled": null,
"maxHeight": null,
"align": "center",
"verticalAlign": "bottom",
"layout": "horizontal",
"width": null,
"margin": 12,
"reversed": false
},
"series": [
{
"name": "c5n.metal by Amazon Web Services",
"color": "#f7981d",
"data": [
{
"x": 1000.1802427180268,
"y": 28596.79734916048
},
{
"x": 995.8108965637628,
"y": 27892.429833034897
},
{
"x": 998.6185026661514,
"y": 27850.148160906057
},
{
"x": 995.6026433855475,
"y": 28285.37975824564
},
{
"x": 1000.1411170678571,
"y": 27767.00991680465
},
{
"x": 998.497700152859,
"y": 28350.604378152893
},
{
"x": 1000.3032836233023,
"y": 28492.566615412492
},
{
"x": 1000.732258904686,
"y": 28445.87840314163
},
{
"x": 1001.0813588870119,
"y": 28347.230760936036
},
{
"x": 998.8608869519749,
"y": 28117.783798767057
},
{
"x": 994.7986575522104,
"y": 28127.27633427582
},
{
"x": 997.895076648319,
"y": 28064.730226937885
},
{
"x": 996.0964178129113,
"y": 28672.858625968176
},
{
"x": 999.9272178060606,
"y": 28007.938953249075
},
{
"x": 1002.8073151478404,
"y": 28537.774839620804
},
{
"x": 999.9823565458291,
"y": 27938.29859795511
},
{
"x": 1000.064193105856,
"y": 28748.998776075565
},
{
"x": 1000.2951655384022,
"y": 28433.521278908906
},
{
"x": 999.0630142219335,
"y": 28477.04471008299
},
{
"x": 995.2934141920095,
"y": 27310.7015042038
}
]
}
],
"drilldown": {},
"tooltip": {
"enabled": true,
"useHTML": false,
"format": null,
"headerFormat": "",
"pointFormat": "<span style=\"color:{series.color}\">Single</span>: <b>{point.x:.0f}</b><br><span style=\"color:{series.color}\">Multi</span>: <b>{point.y:.0f}</b>",
"footerFormat": "",
"shared": false,
"outside": false,
"valueDecimals": null,
"split": false
},
"annotations": null
},
"hc_type": "chart",
"id": "30585053069474089968441000952337089582"
}
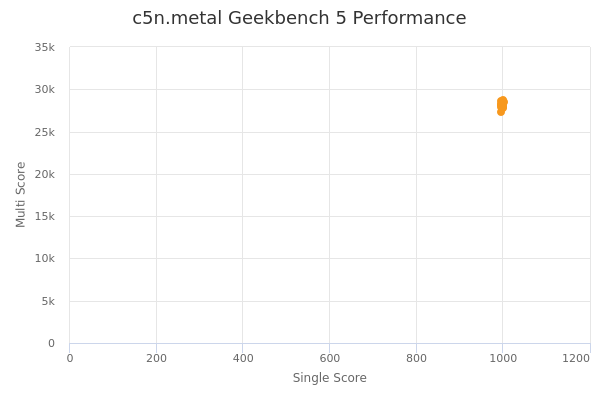
| Single | Multi | |
|---|---|---|
| Max | 1003 | 28749 |
| Average | 999 | 28223 |
| Deviation | 2.16 | 349.70 |
| Min | 995 | 27311 |
Sign up as Freemium to get more insight.
- In same series
- c5n.large
- c5n.xlarge
- c5n.2xlarge
- c5n.4xlarge
- c5n.9xlarge
- c5n.18xlarge
- c5n.metal