c5n.4xlarge by Amazon Web Services
Geekbench is a cross-platform processor benchmark with a scoring system that determines single-core and multi-core performance using loads simulating real-world scenarios. Geekbench 5 score is calculated with a reference score of 2500 representing the performance of the Intel Core i5-2520M @ 2.50 GHz. The software benchmark is available for Mac OS, Windows, Linux, Android and iOS platforms.
Specifications:
CPU
16
RAM
42.0 GB
Net
25000 Mbps
{
"configuration": {
"chart": {
"type": "scatter",
"polar": false,
"zoomType": "",
"options3d": {},
"height": null,
"width": null,
"margin": null,
"inverted": false,
"zooming": {}
},
"credits": {
"enabled": false
},
"title": {
"text": ""
},
"colorAxis": null,
"subtitle": {
"text": ""
},
"xAxis": {
"title": {
"text": [
"Single Score"
],
"useHTML": false,
"style": {
"color": "#666666"
}
},
"categories": null,
"lineWidth": 1,
"tickInterval": null,
"tickWidth": 1,
"tickLength": 10,
"tickPixelInterval": 100,
"plotLines": null,
"labels": {
"enabled": true,
"format": null,
"formatter": "",
"style": {
"color": "#666666",
"cursor": "default",
"fontSize": "11px"
},
"useHTML": false,
"step": 0
},
"plotBands": null,
"visible": true,
"floor": null,
"ceiling": null,
"type": "linear",
"min": 0,
"gridLineWidth": 1,
"gridLineColor": "#e6e6e6",
"minorTickInterval": null,
"minorTickWidth": 0,
"minTickInterval": null,
"startOnTick": true,
"endOnTick": true,
"tickmarkPlacement": 100,
"units": 100,
"minRange": 100
},
"yAxis": {
"title": {
"text": [
"Multi Score"
],
"useHTML": false,
"style": {
"color": "#666666"
}
},
"categories": null,
"plotLines": null,
"plotBands": null,
"lineWidth": null,
"tickInterval": null,
"tickLength": 10,
"floor": null,
"ceiling": null,
"gridLineInterpolation": null,
"gridLineWidth": 1,
"gridLineColor": "#e6e6e6",
"min": 0,
"max": null,
"minorTickInterval": null,
"minorTickWidth": 0,
"minTickInterval": null,
"startOnTick": true,
"endOnTick": true,
"minRange": null,
"type": "linear",
"tickmarkPlacement": null,
"labels": {
"enabled": true,
"formatter": null,
"style": {
"color": "#666666",
"cursor": "default",
"fontSize": "11px"
},
"useHTML": false
}
},
"zAxis": {
"title": {
"text": "Multi Score"
}
},
"plotOptions": {
"series": {
"dataLabels": {
"enabled": false,
"format": null,
"distance": 30,
"align": "center",
"inside": null,
"allowOverlap": false,
"style": {
"fontSize": "11px"
}
},
"showInLegend": null,
"turboThreshold": 0,
"stacking": "",
"groupPadding": 0.2,
"centerInCategory": false,
"findNearestPointBy": "x"
}
},
"navigator": {
"enabled": false
},
"scrollbar": {
"enabled": false
},
"rangeSelector": {
"enabled": false,
"inputEnabled": false
},
"legend": {
"enabled": null,
"maxHeight": null,
"align": "center",
"verticalAlign": "bottom",
"layout": "horizontal",
"width": null,
"margin": 12,
"reversed": false
},
"series": [
{
"name": "c5n.4xlarge by Amazon Web Services",
"color": "#f7981d",
"data": [
{
"x": 976.6640662744588,
"y": 8432.086932062102
},
{
"x": 969.879800100211,
"y": 8429.203522444219
},
{
"x": 973.8054060950294,
"y": 8435.931901572396
},
{
"x": 974.2234385625209,
"y": 8440.005579991019
},
{
"x": 975.3979645259657,
"y": 8457.653469056722
},
{
"x": 973.3647585678564,
"y": 8438.172574693535
},
{
"x": 977.2166653713118,
"y": 8446.269473084376
},
{
"x": 972.3243883478273,
"y": 8434.130430697453
},
{
"x": 969.653879171786,
"y": 8410.829481474397
},
{
"x": 971.8131599151418,
"y": 8412.711519306138
},
{
"x": 971.5464387048585,
"y": 8449.356734221521
},
{
"x": 976.7515342275365,
"y": 8442.618544238067
},
{
"x": 973.2660410513029,
"y": 8455.692172563622
},
{
"x": 973.7399553744672,
"y": 8445.91737531578
},
{
"x": 973.7100842906266,
"y": 8439.644265850036
},
{
"x": 971.0500582675916,
"y": 8416.001519619122
},
{
"x": 971.2855934600805,
"y": 8449.677455774821
},
{
"x": 974.1044290293096,
"y": 8433.432324942976
},
{
"x": 973.1275032056562,
"y": 8430.56477021076
},
{
"x": 972.2982893711481,
"y": 8439.670855669614
},
{
"x": 961.8078764043921,
"y": 8451.785489108282
},
{
"x": 950.6284106306534,
"y": 8407.878240954844
},
{
"x": 964.135323455552,
"y": 8436.665048624453
},
{
"x": 950.941194045484,
"y": 8387.846038376932
},
{
"x": 965.6904559032466,
"y": 8431.939972283726
},
{
"x": 951.1360968490601,
"y": 8388.330395236857
},
{
"x": 964.0629206165589,
"y": 8428.974978577495
},
{
"x": 948.6556237038105,
"y": 8380.408714846712
},
{
"x": 964.7722139854095,
"y": 8422.063070014014
},
{
"x": 952.6316046448451,
"y": 8406.588932537321
},
{
"x": 965.8253773980384,
"y": 8434.990344259757
},
{
"x": 950.0414063641556,
"y": 8402.076179359434
},
{
"x": 962.4348157626218,
"y": 8434.841629864894
},
{
"x": 952.6163692804566,
"y": 8378.529330259016
},
{
"x": 965.6263602323561,
"y": 8434.221127366736
},
{
"x": 952.3671260387372,
"y": 8365.848089362484
},
{
"x": 966.8354763394957,
"y": 8427.637755084543
},
{
"x": 950.4743970778994,
"y": 8362.371273185865
},
{
"x": 964.7381329833254,
"y": 8406.081686946774
},
{
"x": 952.926594643075,
"y": 8385.998218483697
}
]
}
],
"drilldown": {},
"tooltip": {
"enabled": true,
"useHTML": false,
"format": null,
"headerFormat": "",
"pointFormat": "<span style=\"color:{series.color}\">Single</span>: <b>{point.x:.0f}</b><br><span style=\"color:{series.color}\">Multi</span>: <b>{point.y:.0f}</b>",
"footerFormat": "",
"shared": false,
"outside": false,
"valueDecimals": null,
"split": false
},
"annotations": null
},
"hc_type": "chart",
"id": "4162898137223012817163112799695196935"
}
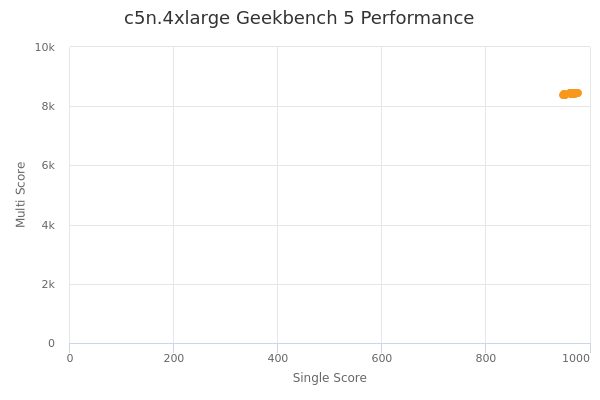
| Single | Multi | |
|---|---|---|
| Max | 977 | 8458 |
| Average | 966 | 8423 |
| Deviation | 9.18 | 24.70 |
| Min | 949 | 8362 |
Sign up as Freemium to get more insight.
- In same series
- c5n.large
- c5n.xlarge
- c5n.2xlarge
- c5n.4xlarge
- c5n.9xlarge
- c5n.18xlarge
- c5n.metal