c5.18xlarge by Amazon Web Services
Geekbench is a cross-platform processor benchmark with a scoring system that determines single-core and multi-core performance using loads simulating real-world scenarios. Geekbench 5 score is calculated with a reference score of 2500 representing the performance of the Intel Core i5-2520M @ 2.50 GHz. The software benchmark is available for Mac OS, Windows, Linux, Android and iOS platforms.
Specifications:
CPU
72
RAM
144.0 GB
Net
25000 Mbps
{
"configuration": {
"chart": {
"type": "scatter",
"polar": false,
"zoomType": "",
"options3d": {},
"height": null,
"width": null,
"margin": null,
"inverted": false,
"zooming": {}
},
"credits": {
"enabled": false
},
"title": {
"text": ""
},
"colorAxis": null,
"subtitle": {
"text": ""
},
"xAxis": {
"title": {
"text": [
"Single Score"
],
"useHTML": false,
"style": {
"color": "#666666"
}
},
"categories": null,
"lineWidth": 1,
"tickInterval": null,
"tickWidth": 1,
"tickLength": 10,
"tickPixelInterval": 100,
"plotLines": null,
"labels": {
"enabled": true,
"format": null,
"formatter": "",
"style": {
"color": "#666666",
"cursor": "default",
"fontSize": "11px"
},
"useHTML": false,
"step": 0
},
"plotBands": null,
"visible": true,
"floor": null,
"ceiling": null,
"type": "linear",
"min": 0,
"gridLineWidth": 1,
"gridLineColor": "#e6e6e6",
"minorTickInterval": null,
"minorTickWidth": 0,
"minTickInterval": null,
"startOnTick": true,
"endOnTick": true,
"tickmarkPlacement": 100,
"units": 100,
"minRange": 100
},
"yAxis": {
"title": {
"text": [
"Multi Score"
],
"useHTML": false,
"style": {
"color": "#666666"
}
},
"categories": null,
"plotLines": null,
"plotBands": null,
"lineWidth": null,
"tickInterval": null,
"tickLength": 10,
"floor": null,
"ceiling": null,
"gridLineInterpolation": null,
"gridLineWidth": 1,
"gridLineColor": "#e6e6e6",
"min": 0,
"max": null,
"minorTickInterval": null,
"minorTickWidth": 0,
"minTickInterval": null,
"startOnTick": true,
"endOnTick": true,
"minRange": null,
"type": "linear",
"tickmarkPlacement": null,
"labels": {
"enabled": true,
"formatter": null,
"style": {
"color": "#666666",
"cursor": "default",
"fontSize": "11px"
},
"useHTML": false
}
},
"zAxis": {
"title": {
"text": "Multi Score"
}
},
"plotOptions": {
"series": {
"dataLabels": {
"enabled": false,
"format": null,
"distance": 30,
"align": "center",
"inside": null,
"allowOverlap": false,
"style": {
"fontSize": "11px"
}
},
"showInLegend": null,
"turboThreshold": 0,
"stacking": "",
"groupPadding": 0.2,
"centerInCategory": false,
"findNearestPointBy": "x"
}
},
"navigator": {
"enabled": false
},
"scrollbar": {
"enabled": false
},
"rangeSelector": {
"enabled": false,
"inputEnabled": false
},
"legend": {
"enabled": null,
"maxHeight": null,
"align": "center",
"verticalAlign": "bottom",
"layout": "horizontal",
"width": null,
"margin": 12,
"reversed": false
},
"series": [
{
"name": "c5.18xlarge by Amazon Web Services",
"color": "#f7981d",
"data": [
{
"x": 973.124357370257,
"y": 28673.75209837011
},
{
"x": 957.953449509787,
"y": 28628.995650015095
},
{
"x": 974.3512704803372,
"y": 28748.140488630335
},
{
"x": 958.0789524225336,
"y": 28675.17418450454
},
{
"x": 973.757216012672,
"y": 29017.078751934365
},
{
"x": 958.3638731043637,
"y": 28737.282497161432
},
{
"x": 973.8236972698344,
"y": 29439.65184622266
},
{
"x": 958.1228998810619,
"y": 28410.327071730986
},
{
"x": 973.9055594406175,
"y": 29232.936572866645
},
{
"x": 958.9175798131259,
"y": 28288.67328010339
},
{
"x": 973.211879028866,
"y": 28752.26329003105
},
{
"x": 958.601557488473,
"y": 28579.10986145222
},
{
"x": 972.8395992079297,
"y": 28849.58157594491
},
{
"x": 957.0213261663523,
"y": 28763.979725732235
},
{
"x": 970.4801127526005,
"y": 28727.07666239813
},
{
"x": 957.7698194641308,
"y": 28654.660784200772
},
{
"x": 973.1065315991887,
"y": 28548.739116396013
},
{
"x": 958.0936672808673,
"y": 28849.89216348473
},
{
"x": 974.1424218805174,
"y": 29362.57752097668
},
{
"x": 958.0520572219714,
"y": 28444.56012531646
},
{
"x": 975.0440605238618,
"y": 29103.350550867388
},
{
"x": 977.7663149015368,
"y": 28890.84961958029
},
{
"x": 978.5434780276635,
"y": 28436.979760806513
},
{
"x": 976.4687327295339,
"y": 28578.43917726098
},
{
"x": 972.4863351473593,
"y": 28807.13812169328
},
{
"x": 978.0757143051785,
"y": 28673.14980967556
},
{
"x": 973.5480692144008,
"y": 29251.53019791344
},
{
"x": 978.0734929338685,
"y": 29389.369130857904
},
{
"x": 972.4833366352195,
"y": 29430.52364815022
},
{
"x": 978.0523076064387,
"y": 28932.477366076833
},
{
"x": 972.3778241963489,
"y": 28524.89645675967
},
{
"x": 977.3627901370819,
"y": 28859.069408862277
},
{
"x": 973.660091846519,
"y": 28894.700352561493
},
{
"x": 978.8178192411144,
"y": 28910.8616872898
},
{
"x": 973.2184470737595,
"y": 28655.0971967046
},
{
"x": 977.7996254546158,
"y": 29112.17622595672
},
{
"x": 972.555149608733,
"y": 29244.05159730361
},
{
"x": 978.9210530552944,
"y": 29461.78039744989
},
{
"x": 972.8817953407854,
"y": 28336.2713054644
},
{
"x": 978.0978536253745,
"y": 29220.153165315605
}
]
}
],
"drilldown": {},
"tooltip": {
"enabled": true,
"useHTML": false,
"format": null,
"headerFormat": "",
"pointFormat": "<span style=\"color:{series.color}\">Single</span>: <b>{point.x:.0f}</b><br><span style=\"color:{series.color}\">Multi</span>: <b>{point.y:.0f}</b>",
"footerFormat": "",
"shared": false,
"outside": false,
"valueDecimals": null,
"split": false
},
"annotations": null
},
"hc_type": "chart",
"id": "117405482125428543672233190726517212514"
}
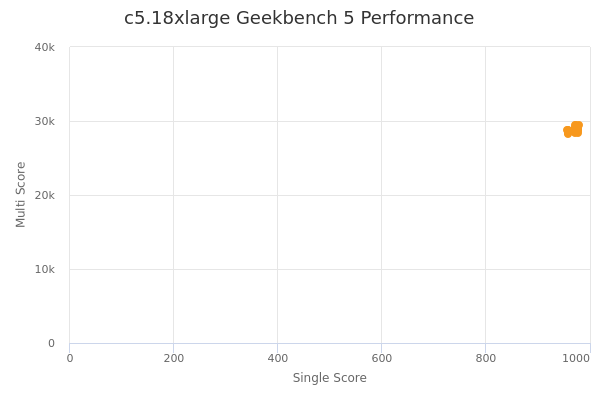
| Single | Multi | |
|---|---|---|
| Max | 979 | 29462 |
| Average | 971 | 28852 |
| Deviation | 7.61 | 320.68 |
| Min | 957 | 28289 |
Sign up as Freemium to get more insight.
- In same series
- c5.large
- c5.xlarge
- c5.2xlarge
- c5.4xlarge
- c5.9xlarge
- c5.12xlarge
- c5.18xlarge
- c5.24xlarge
- c5.metal