c5.9xlarge by Amazon Web Services
Geekbench is a cross-platform processor benchmark with a scoring system that determines single-core and multi-core performance using loads simulating real-world scenarios. Geekbench 5 score is calculated with a reference score of 2500 representing the performance of the Intel Core i5-2520M @ 2.50 GHz. The software benchmark is available for Mac OS, Windows, Linux, Android and iOS platforms.
Specifications:
CPU
36
RAM
72.0 GB
Net
10000 Mbps
{
"configuration": {
"chart": {
"type": "scatter",
"polar": false,
"zoomType": "",
"options3d": {},
"height": null,
"width": null,
"margin": null,
"inverted": false,
"zooming": {}
},
"credits": {
"enabled": false
},
"title": {
"text": ""
},
"colorAxis": null,
"subtitle": {
"text": ""
},
"xAxis": {
"title": {
"text": [
"Single Score"
],
"useHTML": false,
"style": {
"color": "#666666"
}
},
"categories": null,
"lineWidth": 1,
"tickInterval": null,
"tickWidth": 1,
"tickLength": 10,
"tickPixelInterval": 100,
"plotLines": null,
"labels": {
"enabled": true,
"format": null,
"formatter": "",
"style": {
"color": "#666666",
"cursor": "default",
"fontSize": "11px"
},
"useHTML": false,
"step": 0
},
"plotBands": null,
"visible": true,
"floor": null,
"ceiling": null,
"type": "linear",
"min": 0,
"gridLineWidth": 1,
"gridLineColor": "#e6e6e6",
"minorTickInterval": null,
"minorTickWidth": 0,
"minTickInterval": null,
"startOnTick": true,
"endOnTick": true,
"tickmarkPlacement": 100,
"units": 100,
"minRange": 100
},
"yAxis": {
"title": {
"text": [
"Multi Score"
],
"useHTML": false,
"style": {
"color": "#666666"
}
},
"categories": null,
"plotLines": null,
"plotBands": null,
"lineWidth": null,
"tickInterval": null,
"tickLength": 10,
"floor": null,
"ceiling": null,
"gridLineInterpolation": null,
"gridLineWidth": 1,
"gridLineColor": "#e6e6e6",
"min": 0,
"max": null,
"minorTickInterval": null,
"minorTickWidth": 0,
"minTickInterval": null,
"startOnTick": true,
"endOnTick": true,
"minRange": null,
"type": "linear",
"tickmarkPlacement": null,
"labels": {
"enabled": true,
"formatter": null,
"style": {
"color": "#666666",
"cursor": "default",
"fontSize": "11px"
},
"useHTML": false
}
},
"zAxis": {
"title": {
"text": "Multi Score"
}
},
"plotOptions": {
"series": {
"dataLabels": {
"enabled": false,
"format": null,
"distance": 30,
"align": "center",
"inside": null,
"allowOverlap": false,
"style": {
"fontSize": "11px"
}
},
"showInLegend": null,
"turboThreshold": 0,
"stacking": "",
"groupPadding": 0.2,
"centerInCategory": false,
"findNearestPointBy": "x"
}
},
"navigator": {
"enabled": false
},
"scrollbar": {
"enabled": false
},
"rangeSelector": {
"enabled": false,
"inputEnabled": false
},
"legend": {
"enabled": null,
"maxHeight": null,
"align": "center",
"verticalAlign": "bottom",
"layout": "horizontal",
"width": null,
"margin": 12,
"reversed": false
},
"series": [
{
"name": "c5.9xlarge by Amazon Web Services",
"color": "#f7981d",
"data": [
{
"x": 984.8479240884022,
"y": 16853.854149444545
},
{
"x": 980.063041682098,
"y": 16859.416899053518
},
{
"x": 982.2132467944209,
"y": 16859.608570963825
},
{
"x": 977.8033260635875,
"y": 16790.878890408545
},
{
"x": 982.595640601864,
"y": 16763.37402253316
},
{
"x": 982.4128199892921,
"y": 16838.975623583076
},
{
"x": 983.0814665616015,
"y": 16852.938978095524
},
{
"x": 981.4393292466373,
"y": 16834.2776583501
},
{
"x": 982.5586628737393,
"y": 16918.13693475345
},
{
"x": 982.486498299911,
"y": 16744.166690514478
},
{
"x": 981.0382023072566,
"y": 16836.424458656664
},
{
"x": 981.7961383611403,
"y": 16739.494840397736
},
{
"x": 982.0405872772176,
"y": 16823.978425077574
},
{
"x": 982.8251985613487,
"y": 16791.28241141918
},
{
"x": 981.8723355065606,
"y": 16860.43676538866
},
{
"x": 982.5751433761961,
"y": 16843.880816615183
},
{
"x": 981.195225707791,
"y": 16852.133944039582
},
{
"x": 980.0848385948344,
"y": 16847.0053004631
},
{
"x": 982.4530694509475,
"y": 16666.81144816222
},
{
"x": 982.5611904533966,
"y": 16806.712851058797
}
]
}
],
"drilldown": {},
"tooltip": {
"enabled": true,
"useHTML": false,
"format": null,
"headerFormat": "",
"pointFormat": "<span style=\"color:{series.color}\">Single</span>: <b>{point.x:.0f}</b><br><span style=\"color:{series.color}\">Multi</span>: <b>{point.y:.0f}</b>",
"footerFormat": "",
"shared": false,
"outside": false,
"valueDecimals": null,
"split": false
},
"annotations": null
},
"hc_type": "chart",
"id": "64060733532122933244193991857352301410"
}
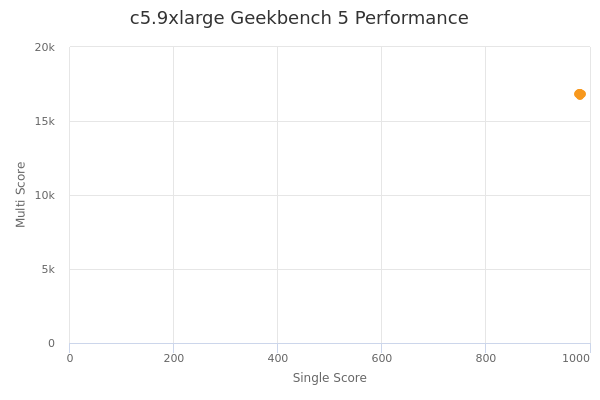
| Single | Multi | |
|---|---|---|
| Max | 985 | 16918 |
| Average | 982 | 16819 |
| Deviation | 1.39 | 55.02 |
| Min | 978 | 16667 |
Sign up as Freemium to get more insight.
- In same series
- c5.large
- c5.xlarge
- c5.2xlarge
- c5.4xlarge
- c5.9xlarge
- c5.12xlarge
- c5.18xlarge
- c5.24xlarge
- c5.metal