c5.metal by Amazon Web Services
Geekbench is a cross-platform processor benchmark with a scoring system that determines single-core and multi-core performance using loads simulating real-world scenarios. Geekbench 5 score is calculated with a reference score of 2500 representing the performance of the Intel Core i5-2520M @ 2.50 GHz. The software benchmark is available for Mac OS, Windows, Linux, Android and iOS platforms.
Specifications:
CPU
96
RAM
192.0 GB
Net
25000 Mbps
{
"configuration": {
"chart": {
"type": "scatter",
"polar": false,
"zoomType": "",
"options3d": {},
"height": null,
"width": null,
"margin": null,
"inverted": false,
"zooming": {}
},
"credits": {
"enabled": false
},
"title": {
"text": ""
},
"colorAxis": null,
"subtitle": {
"text": ""
},
"xAxis": {
"title": {
"text": [
"Single Score"
],
"useHTML": false,
"style": {
"color": "#666666"
}
},
"categories": null,
"lineWidth": 1,
"tickInterval": null,
"tickWidth": 1,
"tickLength": 10,
"tickPixelInterval": 100,
"plotLines": null,
"labels": {
"enabled": true,
"format": null,
"formatter": "",
"style": {
"color": "#666666",
"cursor": "default",
"fontSize": "11px"
},
"useHTML": false,
"step": 0
},
"plotBands": null,
"visible": true,
"floor": null,
"ceiling": null,
"type": "linear",
"min": 0,
"gridLineWidth": 1,
"gridLineColor": "#e6e6e6",
"minorTickInterval": null,
"minorTickWidth": 0,
"minTickInterval": null,
"startOnTick": true,
"endOnTick": true,
"tickmarkPlacement": 100,
"units": 100,
"minRange": 100
},
"yAxis": {
"title": {
"text": [
"Multi Score"
],
"useHTML": false,
"style": {
"color": "#666666"
}
},
"categories": null,
"plotLines": null,
"plotBands": null,
"lineWidth": null,
"tickInterval": null,
"tickLength": 10,
"floor": null,
"ceiling": null,
"gridLineInterpolation": null,
"gridLineWidth": 1,
"gridLineColor": "#e6e6e6",
"min": 0,
"max": null,
"minorTickInterval": null,
"minorTickWidth": 0,
"minTickInterval": null,
"startOnTick": true,
"endOnTick": true,
"minRange": null,
"type": "linear",
"tickmarkPlacement": null,
"labels": {
"enabled": true,
"formatter": null,
"style": {
"color": "#666666",
"cursor": "default",
"fontSize": "11px"
},
"useHTML": false
}
},
"zAxis": {
"title": {
"text": "Multi Score"
}
},
"plotOptions": {
"series": {
"dataLabels": {
"enabled": false,
"format": null,
"distance": 30,
"align": "center",
"inside": null,
"allowOverlap": false,
"style": {
"fontSize": "11px"
}
},
"showInLegend": null,
"turboThreshold": 0,
"stacking": "",
"groupPadding": 0.2,
"centerInCategory": false,
"findNearestPointBy": "x"
}
},
"navigator": {
"enabled": false
},
"scrollbar": {
"enabled": false
},
"rangeSelector": {
"enabled": false,
"inputEnabled": false
},
"legend": {
"enabled": null,
"maxHeight": null,
"align": "center",
"verticalAlign": "bottom",
"layout": "horizontal",
"width": null,
"margin": 12,
"reversed": false
},
"series": [
{
"name": "c5.metal by Amazon Web Services",
"color": "#f7981d",
"data": [
{
"x": 1120.6853614769032,
"y": 36187.09652930364
},
{
"x": 1114.4582108473728,
"y": 36564.53702839825
},
{
"x": 1109.178919572351,
"y": 35815.33362985389
},
{
"x": 1117.5466758569069,
"y": 36819.47926400476
},
{
"x": 1112.3379815338965,
"y": 37880.439101893484
},
{
"x": 1114.1631812333478,
"y": 36714.337217903405
},
{
"x": 1114.0007655126683,
"y": 37418.363861189624
},
{
"x": 1111.0414928770524,
"y": 37000.23607302224
},
{
"x": 1114.9253407036435,
"y": 38136.525953929464
},
{
"x": 1113.3290192519298,
"y": 37193.184050479955
},
{
"x": 1115.782400723258,
"y": 36943.003407242504
},
{
"x": 1112.7759052629208,
"y": 37036.725067265164
},
{
"x": 1115.13708075143,
"y": 37157.593904632544
},
{
"x": 1112.17398865694,
"y": 35639.76556799999
},
{
"x": 1118.7307364660646,
"y": 36665.84558315518
},
{
"x": 1112.3577064667554,
"y": 35980.23629507572
},
{
"x": 1113.6914856137867,
"y": 37189.64851922005
},
{
"x": 1113.0660625923074,
"y": 35699.32167423595
},
{
"x": 1116.2333709039108,
"y": 37035.97093494163
},
{
"x": 1118.3538316536894,
"y": 36043.0851766733
},
{
"x": 1114.721846879559,
"y": 36460.24442640044
},
{
"x": 1121.8394948319874,
"y": 36132.15046756951
},
{
"x": 1112.969678171817,
"y": 36906.36431227692
},
{
"x": 1118.4616990080729,
"y": 36132.459237432086
},
{
"x": 1115.4139257315683,
"y": 37597.940784856364
},
{
"x": 1119.637421214069,
"y": 36402.88078767693
},
{
"x": 1115.2300064119536,
"y": 37213.50219633453
},
{
"x": 1116.8913973018682,
"y": 36946.883429477544
},
{
"x": 1113.4330335628918,
"y": 37487.85961285007
},
{
"x": 1121.9818979796773,
"y": 36465.38979746985
},
{
"x": 1116.8729237203297,
"y": 36592.77312698754
},
{
"x": 1120.8695215062958,
"y": 36271.0625411402
},
{
"x": 1107.821556584261,
"y": 36372.46401184433
},
{
"x": 1114.3444160566214,
"y": 36058.66500692493
},
{
"x": 1115.0155974629301,
"y": 37568.074544812436
},
{
"x": 1119.627397579533,
"y": 37572.329061412
},
{
"x": 1115.061744427042,
"y": 36466.94917832465
},
{
"x": 1118.1975779572379,
"y": 37070.323663485804
},
{
"x": 1115.246212545998,
"y": 37728.50029204678
},
{
"x": 1119.270228752635,
"y": 36081.219696163265
}
]
}
],
"drilldown": {},
"tooltip": {
"enabled": true,
"useHTML": false,
"format": null,
"headerFormat": "",
"pointFormat": "<span style=\"color:{series.color}\">Single</span>: <b>{point.x:.0f}</b><br><span style=\"color:{series.color}\">Multi</span>: <b>{point.y:.0f}</b>",
"footerFormat": "",
"shared": false,
"outside": false,
"valueDecimals": null,
"split": false
},
"annotations": null
},
"hc_type": "chart",
"id": "329961329232662118908229906010748011821"
}
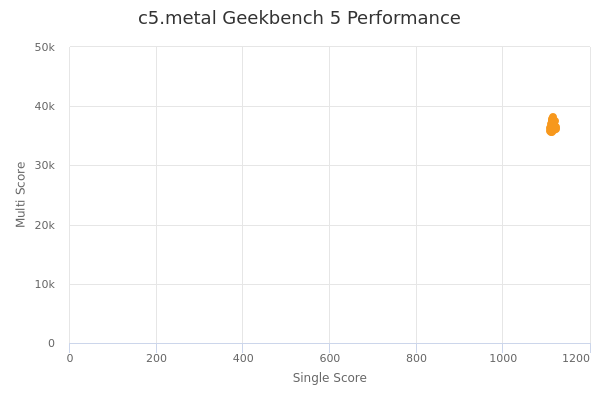
| Single | Multi | |
|---|---|---|
| Max | 1122 | 38137 |
| Average | 1116 | 36766 |
| Deviation | 3.24 | 622.91 |
| Min | 1108 | 35640 |
Sign up as Freemium to get more insight.
- In same series
- c5.large
- c5.xlarge
- c5.2xlarge
- c5.4xlarge
- c5.9xlarge
- c5.12xlarge
- c5.18xlarge
- c5.24xlarge
- c5.metal