4CPU 8GB VOC-C 150GB NVMe by Vultr
Geekbench is a cross-platform processor benchmark with a scoring system that determines single-core and multi-core performance using loads simulating real-world scenarios. Geekbench 5 score is calculated with a reference score of 2500 representing the performance of the Intel Core i5-2520M @ 2.50 GHz. The software benchmark is available for Mac OS, Windows, Linux, Android and iOS platforms.
Specifications:
CPU
4
RAM
8.0 GB
Root
150 GB
4CPU 8GB VOC-C 150GB NVMe root
{
"configuration": {
"chart": {
"type": "scatter",
"polar": false,
"zoomType": "",
"options3d": {},
"height": null,
"width": null,
"margin": null,
"inverted": false,
"zooming": {}
},
"credits": {
"enabled": false
},
"title": {
"text": ""
},
"colorAxis": null,
"subtitle": {
"text": ""
},
"xAxis": {
"title": {
"text": [
"Single Score"
],
"useHTML": false,
"style": {
"color": "#666666"
}
},
"categories": null,
"lineWidth": 1,
"tickInterval": null,
"tickWidth": 1,
"tickLength": 10,
"tickPixelInterval": 100,
"plotLines": null,
"labels": {
"enabled": true,
"format": null,
"formatter": "",
"style": {
"color": "#666666",
"cursor": "default",
"fontSize": "11px"
},
"useHTML": false,
"step": 0
},
"plotBands": null,
"visible": true,
"floor": null,
"ceiling": null,
"type": "linear",
"min": 0,
"gridLineWidth": 1,
"gridLineColor": "#e6e6e6",
"minorTickInterval": null,
"minorTickWidth": 0,
"minTickInterval": null,
"startOnTick": true,
"endOnTick": true,
"tickmarkPlacement": 100,
"units": 100,
"minRange": 100
},
"yAxis": {
"title": {
"text": [
"Multi Score"
],
"useHTML": false,
"style": {
"color": "#666666"
}
},
"categories": null,
"plotLines": null,
"plotBands": null,
"lineWidth": null,
"tickInterval": null,
"tickLength": 10,
"floor": null,
"ceiling": null,
"gridLineInterpolation": null,
"gridLineWidth": 1,
"gridLineColor": "#e6e6e6",
"min": 0,
"max": null,
"minorTickInterval": null,
"minorTickWidth": 0,
"minTickInterval": null,
"startOnTick": true,
"endOnTick": true,
"minRange": null,
"type": "linear",
"tickmarkPlacement": null,
"labels": {
"enabled": true,
"formatter": null,
"style": {
"color": "#666666",
"cursor": "default",
"fontSize": "11px"
},
"useHTML": false
}
},
"zAxis": {
"title": {
"text": "Multi Score"
}
},
"plotOptions": {
"series": {
"dataLabels": {
"enabled": false,
"format": null,
"distance": 30,
"align": "center",
"inside": null,
"allowOverlap": false,
"style": {
"fontSize": "11px"
}
},
"showInLegend": null,
"turboThreshold": 0,
"stacking": "",
"groupPadding": 0.2,
"centerInCategory": false,
"findNearestPointBy": "x"
}
},
"navigator": {
"enabled": false
},
"scrollbar": {
"enabled": false
},
"rangeSelector": {
"enabled": false,
"inputEnabled": false
},
"legend": {
"enabled": null,
"maxHeight": null,
"align": "center",
"verticalAlign": "bottom",
"layout": "horizontal",
"width": null,
"margin": 12,
"reversed": false
},
"series": [
{
"name": "4CPU 8GB VOC-C 150GB NVMe by Vultr",
"color": "#3AB1F2",
"data": [
{
"x": 952.5873041250121,
"y": 3526.1709633643577
},
{
"x": 906.1003569219406,
"y": 3321.310496163085
},
{
"x": 934.6264704836151,
"y": 3433.8205226715518
},
{
"x": 889.2724684087686,
"y": 3319.2114184052593
},
{
"x": 940.1161515226394,
"y": 3526.8968587237086
},
{
"x": 919.0402089690643,
"y": 3421.705485279793
},
{
"x": 928.465364565692,
"y": 3420.258189642352
},
{
"x": 883.7922615078389,
"y": 3302.822384971211
},
{
"x": 885.8761112520008,
"y": 3599.0818293893617
},
{
"x": 898.3916063608804,
"y": 3418.702693523631
},
{
"x": 939.7476943584359,
"y": 3569.321225223117
},
{
"x": 898.4170327035673,
"y": 3314.3052548307987
},
{
"x": 933.8076628971669,
"y": 3525.1885666023068
},
{
"x": 887.7627858491318,
"y": 3311.6335632444325
},
{
"x": 933.9704022176172,
"y": 3536.354826503207
},
{
"x": 899.3338423337243,
"y": 3357.297126641301
},
{
"x": 945.6091908021747,
"y": 3542.1077225267377
},
{
"x": 883.7445542090304,
"y": 3299.2472680593396
},
{
"x": 945.0985829982078,
"y": 3534.3720156063555
},
{
"x": 913.7342254070978,
"y": 3261.5547018476304
}
]
}
],
"drilldown": {},
"tooltip": {
"enabled": true,
"useHTML": false,
"format": null,
"headerFormat": "",
"pointFormat": "<span style=\"color:{series.color}\">Single</span>: <b>{point.x:.0f}</b><br><span style=\"color:{series.color}\">Multi</span>: <b>{point.y:.0f}</b>",
"footerFormat": "",
"shared": false,
"outside": false,
"valueDecimals": null,
"split": false
},
"annotations": null
},
"hc_type": "chart",
"id": "170131917359902979305078313746225174257"
}
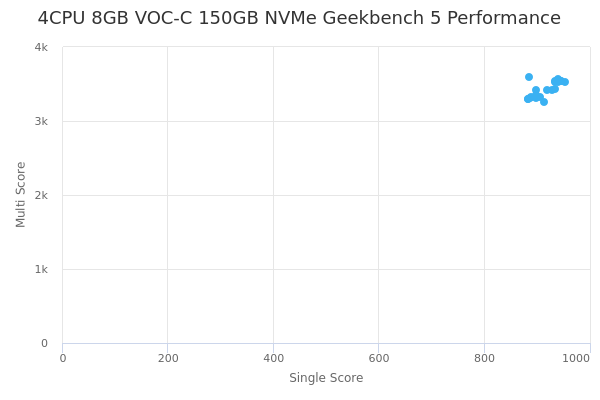
| Single | Multi | |
|---|---|---|
| Max | 953 | 3599 |
| Average | 916 | 3427 |
| Deviation | 23.30 | 107.01 |
| Min | 884 | 3262 |
Sign up as Freemium to get more insight.
- In same series
- 1CPU 2GB VOC-C 25GB NVMe
- 2CPU 4GB VOC-C 50GB NVMe
- 2CPU 4GB VOC-C 75GB NVMe
- 4CPU 8GB VOC-C 150GB NVMe
- 4CPU 8GB VOC-C 75GB NVMe
- 8CPU 16GB VOC-C 150GB NVMe
- 8CPU 16GB VOC-C 300GB NVMe
- 16CPU 32GB VOC-C 300GB NVMe
- 16CPU 32GB VOC-C 500GB NVMe
- 32CPU 64GB VOC-C 1000GB NVMe
- 32CPU 64GB VOC-C 500GB NVMe