2CPU 4GB VOC-C 50GB NVMe by Vultr
Geekbench is a cross-platform processor benchmark with a scoring system that determines single-core and multi-core performance using loads simulating real-world scenarios. Geekbench 5 score is calculated with a reference score of 2500 representing the performance of the Intel Core i5-2520M @ 2.50 GHz. The software benchmark is available for Mac OS, Windows, Linux, Android and iOS platforms.
Specifications:
CPU
2
RAM
4.0 GB
Root
50 GB
2CPU 4GB VOC-C 50GB NVMe root
{
"configuration": {
"chart": {
"type": "scatter",
"polar": false,
"zoomType": "",
"options3d": {},
"height": null,
"width": null,
"margin": null,
"inverted": false,
"zooming": {}
},
"credits": {
"enabled": false
},
"title": {
"text": ""
},
"colorAxis": null,
"subtitle": {
"text": ""
},
"xAxis": {
"title": {
"text": [
"Single Score"
],
"useHTML": false,
"style": {
"color": "#666666"
}
},
"categories": null,
"lineWidth": 1,
"tickInterval": null,
"tickWidth": 1,
"tickLength": 10,
"tickPixelInterval": 100,
"plotLines": null,
"labels": {
"enabled": true,
"format": null,
"formatter": "",
"style": {
"color": "#666666",
"cursor": "default",
"fontSize": "11px"
},
"useHTML": false,
"step": 0
},
"plotBands": null,
"visible": true,
"floor": null,
"ceiling": null,
"type": "linear",
"min": 0,
"gridLineWidth": 1,
"gridLineColor": "#e6e6e6",
"minorTickInterval": null,
"minorTickWidth": 0,
"minTickInterval": null,
"startOnTick": true,
"endOnTick": true,
"tickmarkPlacement": 100,
"units": 100,
"minRange": 100
},
"yAxis": {
"title": {
"text": [
"Multi Score"
],
"useHTML": false,
"style": {
"color": "#666666"
}
},
"categories": null,
"plotLines": null,
"plotBands": null,
"lineWidth": null,
"tickInterval": null,
"tickLength": 10,
"floor": null,
"ceiling": null,
"gridLineInterpolation": null,
"gridLineWidth": 1,
"gridLineColor": "#e6e6e6",
"min": 0,
"max": null,
"minorTickInterval": null,
"minorTickWidth": 0,
"minTickInterval": null,
"startOnTick": true,
"endOnTick": true,
"minRange": null,
"type": "linear",
"tickmarkPlacement": null,
"labels": {
"enabled": true,
"formatter": null,
"style": {
"color": "#666666",
"cursor": "default",
"fontSize": "11px"
},
"useHTML": false
}
},
"zAxis": {
"title": {
"text": "Multi Score"
}
},
"plotOptions": {
"series": {
"dataLabels": {
"enabled": false,
"format": null,
"distance": 30,
"align": "center",
"inside": null,
"allowOverlap": false,
"style": {
"fontSize": "11px"
}
},
"showInLegend": null,
"turboThreshold": 0,
"stacking": "",
"groupPadding": 0.2,
"centerInCategory": false,
"findNearestPointBy": "x"
}
},
"navigator": {
"enabled": false
},
"scrollbar": {
"enabled": false
},
"rangeSelector": {
"enabled": false,
"inputEnabled": false
},
"legend": {
"enabled": null,
"maxHeight": null,
"align": "center",
"verticalAlign": "bottom",
"layout": "horizontal",
"width": null,
"margin": 12,
"reversed": false
},
"series": [
{
"name": "2CPU 4GB VOC-C 50GB NVMe by Vultr",
"color": "#3AB1F2",
"data": [
{
"x": 935.6624588154119,
"y": 1851.4034633617734
},
{
"x": 914.8000099162281,
"y": 1745.459653285703
},
{
"x": 940.9215846363277,
"y": 1851.0947427041551
},
{
"x": 907.6701337411882,
"y": 1763.152208407997
},
{
"x": 944.7566673261304,
"y": 1824.9134433431213
},
{
"x": 853.3570247283126,
"y": 1781.713665790448
},
{
"x": 938.6659108987535,
"y": 1829.3502517975492
},
{
"x": 910.0781667259967,
"y": 1735.7142626111336
},
{
"x": 938.8819007127572,
"y": 1804.8893326971652
},
{
"x": 879.1254657028755,
"y": 1749.810907779673
},
{
"x": 934.0566936092355,
"y": 1847.0761654601733
},
{
"x": 903.7141256365663,
"y": 1772.5567065791734
},
{
"x": 929.534944763368,
"y": 1835.492908300609
},
{
"x": 901.3261524336792,
"y": 1774.543950891442
},
{
"x": 937.7677554860263,
"y": 1819.536330832121
},
{
"x": 895.486663249111,
"y": 1760.5131263906728
},
{
"x": 935.6480444401295,
"y": 1813.1702115379771
},
{
"x": 904.5540160087185,
"y": 1745.0285983495087
},
{
"x": 926.7251726471031,
"y": 1823.0658713402709
},
{
"x": 918.6556820401021,
"y": 1749.9854594948783
}
]
}
],
"drilldown": {},
"tooltip": {
"enabled": true,
"useHTML": false,
"format": null,
"headerFormat": "",
"pointFormat": "<span style=\"color:{series.color}\">Single</span>: <b>{point.x:.0f}</b><br><span style=\"color:{series.color}\">Multi</span>: <b>{point.y:.0f}</b>",
"footerFormat": "",
"shared": false,
"outside": false,
"valueDecimals": null,
"split": false
},
"annotations": null
},
"hc_type": "chart",
"id": "161405456808926288229908379887080968717"
}
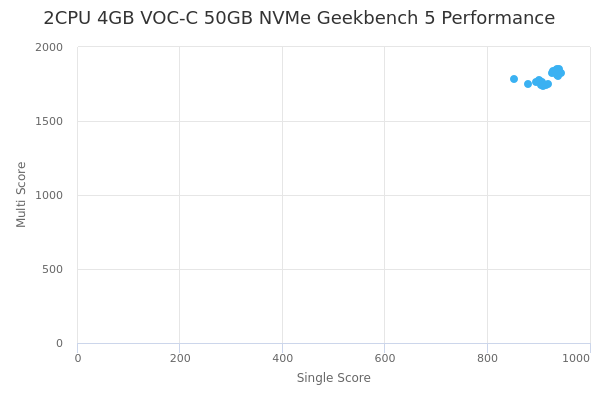
| Single | Multi | |
|---|---|---|
| Max | 945 | 1851 |
| Average | 918 | 1794 |
| Deviation | 23.05 | 38.98 |
| Min | 853 | 1736 |
Sign up as Freemium to get more insight.
- In same series
- 1CPU 2GB VOC-C 25GB NVMe
- 2CPU 4GB VOC-C 50GB NVMe
- 2CPU 4GB VOC-C 75GB NVMe
- 4CPU 8GB VOC-C 150GB NVMe
- 4CPU 8GB VOC-C 75GB NVMe
- 8CPU 16GB VOC-C 150GB NVMe
- 8CPU 16GB VOC-C 300GB NVMe
- 16CPU 32GB VOC-C 300GB NVMe
- 16CPU 32GB VOC-C 500GB NVMe
- 32CPU 64GB VOC-C 1000GB NVMe
- 32CPU 64GB VOC-C 500GB NVMe