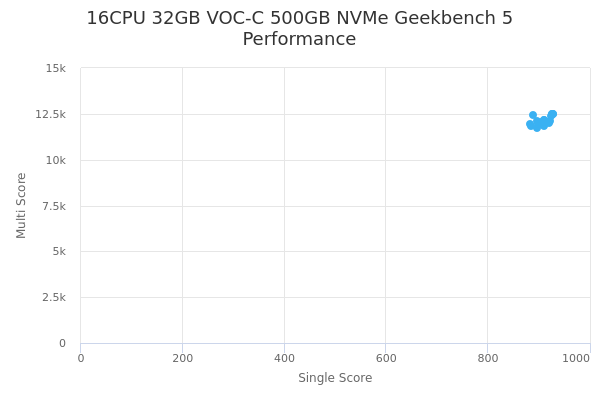
16CPU 32GB VOC-C 500GB NVMe by Vultr
Geekbench is a cross-platform processor benchmark with a scoring system that determines single-core and multi-core performance using loads simulating real-world scenarios. Geekbench 5 score is calculated with a reference score of 2500 representing the performance of the Intel Core i5-2520M @ 2.50 GHz. The software benchmark is available for Mac OS, Windows, Linux, Android and iOS platforms.
Specifications:
CPU
16
RAM
32.0 GB
Root
500 GB
16CPU 32GB VOC-C 500GB NVMe root
{
"configuration": {
"chart": {
"type": "scatter",
"polar": false,
"zoomType": "",
"options3d": {},
"height": null,
"width": null,
"margin": null,
"inverted": false,
"zooming": {}
},
"credits": {
"enabled": false
},
"title": {
"text": ""
},
"colorAxis": null,
"subtitle": {
"text": ""
},
"xAxis": {
"title": {
"text": [
"Single Score"
],
"useHTML": false,
"style": {
"color": "#666666"
}
},
"categories": null,
"lineWidth": 1,
"tickInterval": null,
"tickWidth": 1,
"tickLength": 10,
"tickPixelInterval": 100,
"plotLines": null,
"labels": {
"enabled": true,
"format": null,
"formatter": "",
"style": {
"color": "#666666",
"cursor": "default",
"fontSize": "11px"
},
"useHTML": false,
"step": 0
},
"plotBands": null,
"visible": true,
"floor": null,
"ceiling": null,
"type": "linear",
"min": 0,
"gridLineWidth": 1,
"gridLineColor": "#e6e6e6",
"minorTickInterval": null,
"minorTickWidth": 0,
"minTickInterval": null,
"startOnTick": true,
"endOnTick": true,
"tickmarkPlacement": 100,
"units": 100,
"minRange": 100
},
"yAxis": {
"title": {
"text": [
"Multi Score"
],
"useHTML": false,
"style": {
"color": "#666666"
}
},
"categories": null,
"plotLines": null,
"plotBands": null,
"lineWidth": null,
"tickInterval": null,
"tickLength": 10,
"floor": null,
"ceiling": null,
"gridLineInterpolation": null,
"gridLineWidth": 1,
"gridLineColor": "#e6e6e6",
"min": 0,
"max": null,
"minorTickInterval": null,
"minorTickWidth": 0,
"minTickInterval": null,
"startOnTick": true,
"endOnTick": true,
"minRange": null,
"type": "linear",
"tickmarkPlacement": null,
"labels": {
"enabled": true,
"formatter": null,
"style": {
"color": "#666666",
"cursor": "default",
"fontSize": "11px"
},
"useHTML": false
}
},
"zAxis": {
"title": {
"text": "Multi Score"
}
},
"plotOptions": {
"series": {
"dataLabels": {
"enabled": false,
"format": null,
"distance": 30,
"align": "center",
"inside": null,
"allowOverlap": false,
"style": {
"fontSize": "11px"
}
},
"showInLegend": null,
"turboThreshold": 0,
"stacking": "",
"groupPadding": 0.2,
"centerInCategory": false,
"findNearestPointBy": "x"
}
},
"navigator": {
"enabled": false
},
"scrollbar": {
"enabled": false
},
"rangeSelector": {
"enabled": false,
"inputEnabled": false
},
"legend": {
"enabled": null,
"maxHeight": null,
"align": "center",
"verticalAlign": "bottom",
"layout": "horizontal",
"width": null,
"margin": 12,
"reversed": false
},
"series": [
{
"name": "16CPU 32GB VOC-C 500GB NVMe by Vultr",
"color": "#3AB1F2",
"data": [
{
"x": 920.8910216268055,
"y": 12013.672906458221
},
{
"x": 895.9450807220896,
"y": 11708.93109610612
},
{
"x": 929.0956803617605,
"y": 12463.699146073453
},
{
"x": 907.3248662813988,
"y": 12039.550549021558
},
{
"x": 928.8057515991948,
"y": 12470.14977400512
},
{
"x": 896.1371316507393,
"y": 12111.181101237897
},
{
"x": 889.6515533575205,
"y": 12410.126743921417
},
{
"x": 907.1409555814032,
"y": 12003.102224501004
},
{
"x": 925.9280278493643,
"y": 12508.989177554979
},
{
"x": 898.4608661700324,
"y": 11922.963227020418
},
{
"x": 911.1909935798703,
"y": 12145.804303177601
},
{
"x": 885.2138767124941,
"y": 11839.328981569744
},
{
"x": 921.5221821337293,
"y": 12113.102402844464
},
{
"x": 882.8261069588465,
"y": 11971.391261308174
},
{
"x": 923.4431348990304,
"y": 12357.344254480278
},
{
"x": 907.3270891273016,
"y": 11952.859390149908
},
{
"x": 910.534696593277,
"y": 12178.365919483185
},
{
"x": 906.3849078433445,
"y": 12001.312308039862
},
{
"x": 925.8178785884611,
"y": 12482.979435631622
},
{
"x": 911.2953485036833,
"y": 11859.596236390185
}
]
}
],
"drilldown": {},
"tooltip": {
"enabled": true,
"useHTML": false,
"format": null,
"headerFormat": "",
"pointFormat": "<span style=\"color:{series.color}\">Single</span>: <b>{point.x:.0f}</b><br><span style=\"color:{series.color}\">Multi</span>: <b>{point.y:.0f}</b>",
"footerFormat": "",
"shared": false,
"outside": false,
"valueDecimals": null,
"split": false
},
"annotations": null
},
"hc_type": "chart",
"id": "175384085607591700212016054877960566789"
}
| Single | Multi | |
|---|---|---|
| Max | 929 | 12509 |
| Average | 909 | 12128 |
| Deviation | 14.09 | 236.35 |
| Min | 883 | 11709 |
Sign up as Freemium to get more insight.
- In same series
- 1CPU 2GB VOC-C 25GB NVMe
- 2CPU 4GB VOC-C 50GB NVMe
- 2CPU 4GB VOC-C 75GB NVMe
- 4CPU 8GB VOC-C 150GB NVMe
- 4CPU 8GB VOC-C 75GB NVMe
- 8CPU 16GB VOC-C 150GB NVMe
- 8CPU 16GB VOC-C 300GB NVMe
- 16CPU 32GB VOC-C 300GB NVMe
- 16CPU 32GB VOC-C 500GB NVMe
- 32CPU 64GB VOC-C 1000GB NVMe
- 32CPU 64GB VOC-C 500GB NVMe