16xCPU-64GB by UpCloud
Geekbench is a cross-platform processor benchmark with a scoring system that determines single-core and multi-core performance using loads simulating real-world scenarios. Geekbench 5 score is calculated with a reference score of 2500 representing the performance of the Intel Core i5-2520M @ 2.50 GHz. The software benchmark is available for Mac OS, Windows, Linux, Android and iOS platforms.
Specifications:
CPU
16
RAM
64.0 GB
Root
1280 GB
Root 16xCPU-64GB MaxIOPS
{
"configuration": {
"chart": {
"type": "scatter",
"polar": false,
"zoomType": "",
"options3d": {},
"height": null,
"width": null,
"margin": null,
"inverted": false,
"zooming": {}
},
"credits": {
"enabled": false
},
"title": {
"text": ""
},
"colorAxis": null,
"subtitle": {
"text": ""
},
"xAxis": {
"title": {
"text": [
"Single Score"
],
"useHTML": false,
"style": {
"color": "#666666"
}
},
"categories": null,
"lineWidth": 1,
"tickInterval": null,
"tickWidth": 1,
"tickLength": 10,
"tickPixelInterval": 100,
"plotLines": null,
"labels": {
"enabled": true,
"format": null,
"formatter": "",
"style": {
"color": "#666666",
"cursor": "default",
"fontSize": "11px"
},
"useHTML": false,
"step": 0
},
"plotBands": null,
"visible": true,
"floor": null,
"ceiling": null,
"type": "linear",
"min": 0,
"gridLineWidth": 1,
"gridLineColor": "#e6e6e6",
"minorTickInterval": null,
"minorTickWidth": 0,
"minTickInterval": null,
"startOnTick": true,
"endOnTick": true,
"tickmarkPlacement": 100,
"units": 100,
"minRange": 100
},
"yAxis": {
"title": {
"text": [
"Multi Score"
],
"useHTML": false,
"style": {
"color": "#666666"
}
},
"categories": null,
"plotLines": null,
"plotBands": null,
"lineWidth": null,
"tickInterval": null,
"tickLength": 10,
"floor": null,
"ceiling": null,
"gridLineInterpolation": null,
"gridLineWidth": 1,
"gridLineColor": "#e6e6e6",
"min": 0,
"max": null,
"minorTickInterval": null,
"minorTickWidth": 0,
"minTickInterval": null,
"startOnTick": true,
"endOnTick": true,
"minRange": null,
"type": "linear",
"tickmarkPlacement": null,
"labels": {
"enabled": true,
"formatter": null,
"style": {
"color": "#666666",
"cursor": "default",
"fontSize": "11px"
},
"useHTML": false
}
},
"zAxis": {
"title": {
"text": "Multi Score"
}
},
"plotOptions": {
"series": {
"dataLabels": {
"enabled": false,
"format": null,
"distance": 30,
"align": "center",
"inside": null,
"allowOverlap": false,
"style": {
"fontSize": "11px"
}
},
"showInLegend": null,
"turboThreshold": 0,
"stacking": "",
"groupPadding": 0.2,
"centerInCategory": false,
"findNearestPointBy": "x"
}
},
"navigator": {
"enabled": false
},
"scrollbar": {
"enabled": false
},
"rangeSelector": {
"enabled": false,
"inputEnabled": false
},
"legend": {
"enabled": null,
"maxHeight": null,
"align": "center",
"verticalAlign": "bottom",
"layout": "horizontal",
"width": null,
"margin": 12,
"reversed": false
},
"series": [
{
"name": "16xCPU-64GB by UpCloud",
"color": "#8b00ff",
"data": [
{
"x": 907.5652592754211,
"y": 10713.918700009233
},
{
"x": 856.8175579818833,
"y": 10764.98679140659
},
{
"x": 882.7228869246474,
"y": 11022.732783644227
},
{
"x": 881.165728813334,
"y": 10968.476148012216
},
{
"x": 889.8228964734483,
"y": 11154.13405717125
},
{
"x": 877.4156032849437,
"y": 9130.86783561329
},
{
"x": 872.9218401983655,
"y": 9326.185496710765
},
{
"x": 901.8633820659047,
"y": 8977.470871278374
},
{
"x": 882.6292674651903,
"y": 9074.567506397903
},
{
"x": 905.6087164777178,
"y": 9658.878485814801
},
{
"x": 884.4512975747932,
"y": 9348.212582861894
},
{
"x": 914.9361809999443,
"y": 9490.142664748955
},
{
"x": 915.394381452357,
"y": 9683.404832175382
},
{
"x": 906.0998156754456,
"y": 9530.06052914464
},
{
"x": 883.8724946803277,
"y": 9285.392332570884
},
{
"x": 863.0655320818053,
"y": 9516.407094492013
},
{
"x": 869.2906370323587,
"y": 9671.309719630684
},
{
"x": 887.3015210447958,
"y": 9683.007046651612
},
{
"x": 888.5521375078939,
"y": 9443.288683006222
},
{
"x": 871.9095697685711,
"y": 9943.788272910348
},
{
"x": 908.4495390568989,
"y": 9457.68199138378
},
{
"x": 905.4644037180385,
"y": 9692.704162760308
},
{
"x": 891.8301068522937,
"y": 9314.578744860379
},
{
"x": 900.6062670070587,
"y": 9699.389351222737
},
{
"x": 883.7286767112785,
"y": 9328.176234182896
}
]
}
],
"drilldown": {},
"tooltip": {
"enabled": true,
"useHTML": false,
"format": null,
"headerFormat": "",
"pointFormat": "<span style=\"color:{series.color}\">Single</span>: <b>{point.x:.0f}</b><br><span style=\"color:{series.color}\">Multi</span>: <b>{point.y:.0f}</b>",
"footerFormat": "",
"shared": false,
"outside": false,
"valueDecimals": null,
"split": false
},
"annotations": null
},
"hc_type": "chart",
"id": "72413697582841835150133927050569458751"
}
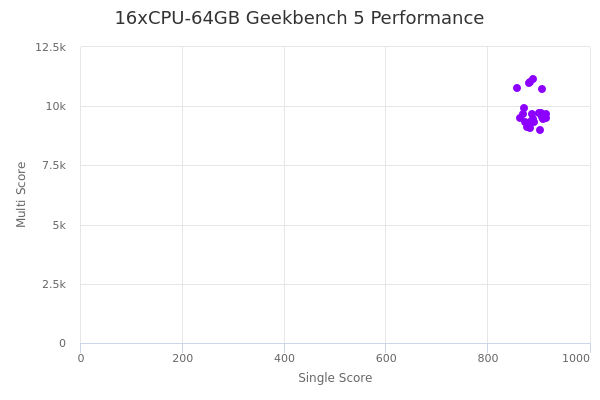
| Single | Multi | |
|---|---|---|
| Max | 915 | 11154 |
| Average | 889 | 9755 |
| Deviation | 15.80 | 626.49 |
| Min | 857 | 8977 |
Sign up as Freemium to get more insight.