1xCPU-1GB by UpCloud
Geekbench is a cross-platform processor benchmark with a scoring system that determines single-core and multi-core performance using loads simulating real-world scenarios. Geekbench 5 score is calculated with a reference score of 2500 representing the performance of the Intel Core i5-2520M @ 2.50 GHz. The software benchmark is available for Mac OS, Windows, Linux, Android and iOS platforms.
Specifications:
CPU
1
RAM
1.0 GB
Root
25 GB
Root 1xCPU-1GB MaxIOPS
{
"configuration": {
"chart": {
"type": "scatter",
"polar": false,
"zoomType": "",
"options3d": {},
"height": null,
"width": null,
"margin": null,
"inverted": false,
"zooming": {}
},
"credits": {
"enabled": false
},
"title": {
"text": ""
},
"colorAxis": null,
"subtitle": {
"text": ""
},
"xAxis": {
"title": {
"text": [
"Single Score"
],
"useHTML": false,
"style": {
"color": "#666666"
}
},
"categories": null,
"lineWidth": 1,
"tickInterval": null,
"tickWidth": 1,
"tickLength": 10,
"tickPixelInterval": 100,
"plotLines": null,
"labels": {
"enabled": true,
"format": null,
"formatter": "",
"style": {
"color": "#666666",
"cursor": "default",
"fontSize": "11px"
},
"useHTML": false,
"step": 0
},
"plotBands": null,
"visible": true,
"floor": null,
"ceiling": null,
"type": "linear",
"min": 0,
"gridLineWidth": 1,
"gridLineColor": "#e6e6e6",
"minorTickInterval": null,
"minorTickWidth": 0,
"minTickInterval": null,
"startOnTick": true,
"endOnTick": true,
"tickmarkPlacement": 100,
"units": 100,
"minRange": 100
},
"yAxis": {
"title": {
"text": [
"Multi Score"
],
"useHTML": false,
"style": {
"color": "#666666"
}
},
"categories": null,
"plotLines": null,
"plotBands": null,
"lineWidth": null,
"tickInterval": null,
"tickLength": 10,
"floor": null,
"ceiling": null,
"gridLineInterpolation": null,
"gridLineWidth": 1,
"gridLineColor": "#e6e6e6",
"min": 0,
"max": null,
"minorTickInterval": null,
"minorTickWidth": 0,
"minTickInterval": null,
"startOnTick": true,
"endOnTick": true,
"minRange": null,
"type": "linear",
"tickmarkPlacement": null,
"labels": {
"enabled": true,
"formatter": null,
"style": {
"color": "#666666",
"cursor": "default",
"fontSize": "11px"
},
"useHTML": false
}
},
"zAxis": {
"title": {
"text": "Multi Score"
}
},
"plotOptions": {
"series": {
"dataLabels": {
"enabled": false,
"format": null,
"distance": 30,
"align": "center",
"inside": null,
"allowOverlap": false,
"style": {
"fontSize": "11px"
}
},
"showInLegend": null,
"turboThreshold": 0,
"stacking": "",
"groupPadding": 0.2,
"centerInCategory": false,
"findNearestPointBy": "x"
}
},
"navigator": {
"enabled": false
},
"scrollbar": {
"enabled": false
},
"rangeSelector": {
"enabled": false,
"inputEnabled": false
},
"legend": {
"enabled": null,
"maxHeight": null,
"align": "center",
"verticalAlign": "bottom",
"layout": "horizontal",
"width": null,
"margin": 12,
"reversed": false
},
"series": [
{
"name": "1xCPU-1GB by UpCloud",
"color": "#8b00ff",
"data": [
{
"x": 704.970503440459,
"y": 706.0253768295629
},
{
"x": 702.0481697729294,
"y": 702.2912472213252
},
{
"x": 694.2665206500441,
"y": 699.5836132109883
},
{
"x": 713.9084839531779,
"y": 706.2477086205845
},
{
"x": 714.7605862473144,
"y": 699.1346583633749
},
{
"x": 816.1197651123535,
"y": 802.0961304327834
},
{
"x": 794.2770732157953,
"y": 803.7215230283916
},
{
"x": 841.4995413958143,
"y": 833.4268041007177
},
{
"x": 826.2439619098355,
"y": 825.4257433545815
},
{
"x": 832.1873803257317,
"y": 791.0956484971476
},
{
"x": 812.9349217461448,
"y": 835.9587987331438
},
{
"x": 830.7056518727823,
"y": 849.4667229381106
},
{
"x": 825.7206108145527,
"y": 826.6838138205155
},
{
"x": 842.3093807500059,
"y": 842.5346274361559
},
{
"x": 852.2692866023312,
"y": 822.790614297893
},
{
"x": 987.7041911831013,
"y": 976.9127842003936
},
{
"x": 977.4374533541354,
"y": 974.3556982255332
},
{
"x": 986.6885453557547,
"y": 992.5967724913603
},
{
"x": 978.3643090244021,
"y": 973.2721028575975
},
{
"x": 991.321168738961,
"y": 972.9561112831661
},
{
"x": 981.6289912879024,
"y": 987.0319615824542
},
{
"x": 987.4222030003881,
"y": 980.1756812963617
},
{
"x": 980.8426939137245,
"y": 981.0657510203157
},
{
"x": 993.1527319694862,
"y": 990.4013971193481
},
{
"x": 988.6576135554642,
"y": 989.5281793795334
}
]
}
],
"drilldown": {},
"tooltip": {
"enabled": true,
"useHTML": false,
"format": null,
"headerFormat": "",
"pointFormat": "<span style=\"color:{series.color}\">Single</span>: <b>{point.x:.0f}</b><br><span style=\"color:{series.color}\">Multi</span>: <b>{point.y:.0f}</b>",
"footerFormat": "",
"shared": false,
"outside": false,
"valueDecimals": null,
"split": false
},
"annotations": null
},
"hc_type": "chart",
"id": "305488347812790168739845959989044882649"
}
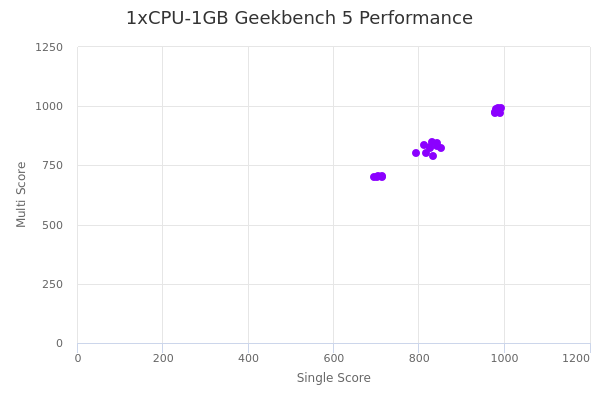
| Single | Multi | |
|---|---|---|
| Max | 993 | 993 |
| Average | 866 | 863 |
| Deviation | 107.39 | 107.57 |
| Min | 694 | 699 |
Sign up as Freemium to get more insight.