ENT1-S by Scaleway
Geekbench is a cross-platform processor benchmark with a scoring system that determines single-core and multi-core performance using loads simulating real-world scenarios. Geekbench 5 score is calculated with a reference score of 2500 representing the performance of the Intel Core i5-2520M @ 2.50 GHz. The software benchmark is available for Mac OS, Windows, Linux, Android and iOS platforms.
Specifications:
CPU
8
RAM
32.0 GB
Net
1525 Mbps
{
"configuration": {
"chart": {
"type": "scatter",
"polar": false,
"zoomType": "",
"options3d": {},
"height": null,
"width": null,
"margin": null,
"inverted": false,
"zooming": {}
},
"credits": {
"enabled": false
},
"title": {
"text": ""
},
"colorAxis": null,
"subtitle": {
"text": ""
},
"xAxis": {
"title": {
"text": [
"Single Score"
],
"useHTML": false,
"style": {
"color": "#666666"
}
},
"categories": null,
"lineWidth": 1,
"tickInterval": null,
"tickWidth": 1,
"tickLength": 10,
"tickPixelInterval": 100,
"plotLines": null,
"labels": {
"enabled": true,
"format": null,
"formatter": "",
"style": {
"color": "#666666",
"cursor": "default",
"fontSize": "11px"
},
"useHTML": false,
"step": 0
},
"plotBands": null,
"visible": true,
"floor": null,
"ceiling": null,
"type": "linear",
"min": 0,
"gridLineWidth": 1,
"gridLineColor": "#e6e6e6",
"minorTickInterval": null,
"minorTickWidth": 0,
"minTickInterval": null,
"startOnTick": true,
"endOnTick": true,
"tickmarkPlacement": 100,
"units": 100,
"minRange": 100
},
"yAxis": {
"title": {
"text": [
"Multi Score"
],
"useHTML": false,
"style": {
"color": "#666666"
}
},
"categories": null,
"plotLines": null,
"plotBands": null,
"lineWidth": null,
"tickInterval": null,
"tickLength": 10,
"floor": null,
"ceiling": null,
"gridLineInterpolation": null,
"gridLineWidth": 1,
"gridLineColor": "#e6e6e6",
"min": 0,
"max": null,
"minorTickInterval": null,
"minorTickWidth": 0,
"minTickInterval": null,
"startOnTick": true,
"endOnTick": true,
"minRange": null,
"type": "linear",
"tickmarkPlacement": null,
"labels": {
"enabled": true,
"formatter": null,
"style": {
"color": "#666666",
"cursor": "default",
"fontSize": "11px"
},
"useHTML": false
}
},
"zAxis": {
"title": {
"text": "Multi Score"
}
},
"plotOptions": {
"series": {
"dataLabels": {
"enabled": false,
"format": null,
"distance": 30,
"align": "center",
"inside": null,
"allowOverlap": false,
"style": {
"fontSize": "11px"
}
},
"showInLegend": null,
"turboThreshold": 0,
"stacking": "",
"groupPadding": 0.2,
"centerInCategory": false,
"findNearestPointBy": "x"
}
},
"navigator": {
"enabled": false
},
"scrollbar": {
"enabled": false
},
"rangeSelector": {
"enabled": false,
"inputEnabled": false
},
"legend": {
"enabled": null,
"maxHeight": null,
"align": "center",
"verticalAlign": "bottom",
"layout": "horizontal",
"width": null,
"margin": 12,
"reversed": false
},
"series": [
{
"name": "ENT1-S by Scaleway",
"color": "#510099",
"data": [
{
"x": 1145.2670860471007,
"y": 7366.741456806116
},
{
"x": 1068.0594636963904,
"y": 7376.52052169832
},
{
"x": 1151.6070581131146,
"y": 7101.92896807617
},
{
"x": 1144.5219430715438,
"y": 7446.414494526269
},
{
"x": 1142.2650820116019,
"y": 7334.043408129077
},
{
"x": 1056.442748879856,
"y": 7274.617451257713
},
{
"x": 1067.6429015658578,
"y": 7338.979476078863
},
{
"x": 1072.0582080371832,
"y": 7257.369689026893
},
{
"x": 1081.1607857323497,
"y": 7421.174926120577
},
{
"x": 1048.0995774271921,
"y": 7196.444487436371
},
{
"x": 1063.580686665447,
"y": 7436.657992983749
},
{
"x": 1070.6549961312712,
"y": 7226.378657765486
},
{
"x": 1060.937410889021,
"y": 7453.35982925795
},
{
"x": 1079.9106532166693,
"y": 7365.838878464192
},
{
"x": 1163.3514539977184,
"y": 7294.427279508489
},
{
"x": 1068.2993926615695,
"y": 7399.371880998726
},
{
"x": 1132.198569757992,
"y": 7147.776283006408
},
{
"x": 1086.2346748650689,
"y": 7389.822857996893
},
{
"x": 1063.8432239356414,
"y": 7289.481420920258
},
{
"x": 1067.4561252096428,
"y": 7452.501974956071
}
]
}
],
"drilldown": {},
"tooltip": {
"enabled": true,
"useHTML": false,
"format": null,
"headerFormat": "",
"pointFormat": "<span style=\"color:{series.color}\">Single</span>: <b>{point.x:.0f}</b><br><span style=\"color:{series.color}\">Multi</span>: <b>{point.y:.0f}</b>",
"footerFormat": "",
"shared": false,
"outside": false,
"valueDecimals": null,
"split": false
},
"annotations": null
},
"hc_type": "chart",
"id": "75342257298346863677981032039125325358"
}
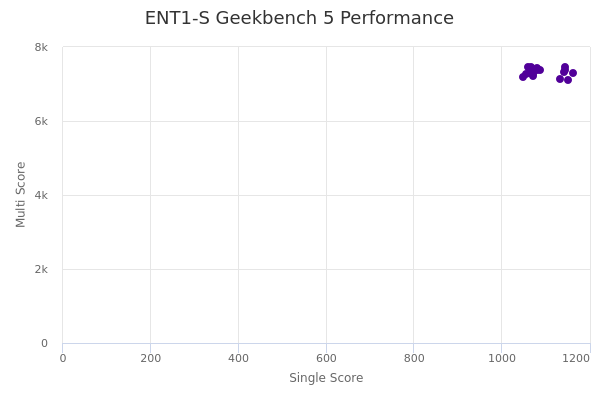
| Single | Multi | |
|---|---|---|
| Max | 1163 | 7453 |
| Average | 1092 | 7328 |
| Deviation | 37.16 | 100.44 |
| Min | 1048 | 7102 |