ENT1-M by Scaleway
Geekbench is a cross-platform processor benchmark with a scoring system that determines single-core and multi-core performance using loads simulating real-world scenarios. Geekbench 5 score is calculated with a reference score of 2500 representing the performance of the Intel Core i5-2520M @ 2.50 GHz. The software benchmark is available for Mac OS, Windows, Linux, Android and iOS platforms.
Specifications:
CPU
16
RAM
64.0 GB
Net
3051 Mbps
{
"configuration": {
"chart": {
"type": "scatter",
"polar": false,
"zoomType": "",
"options3d": {},
"height": null,
"width": null,
"margin": null,
"inverted": false,
"zooming": {}
},
"credits": {
"enabled": false
},
"title": {
"text": ""
},
"colorAxis": null,
"subtitle": {
"text": ""
},
"xAxis": {
"title": {
"text": [
"Single Score"
],
"useHTML": false,
"style": {
"color": "#666666"
}
},
"categories": null,
"lineWidth": 1,
"tickInterval": null,
"tickWidth": 1,
"tickLength": 10,
"tickPixelInterval": 100,
"plotLines": null,
"labels": {
"enabled": true,
"format": null,
"formatter": "",
"style": {
"color": "#666666",
"cursor": "default",
"fontSize": "11px"
},
"useHTML": false,
"step": 0
},
"plotBands": null,
"visible": true,
"floor": null,
"ceiling": null,
"type": "linear",
"min": 0,
"gridLineWidth": 1,
"gridLineColor": "#e6e6e6",
"minorTickInterval": null,
"minorTickWidth": 0,
"minTickInterval": null,
"startOnTick": true,
"endOnTick": true,
"tickmarkPlacement": 100,
"units": 100,
"minRange": 100
},
"yAxis": {
"title": {
"text": [
"Multi Score"
],
"useHTML": false,
"style": {
"color": "#666666"
}
},
"categories": null,
"plotLines": null,
"plotBands": null,
"lineWidth": null,
"tickInterval": null,
"tickLength": 10,
"floor": null,
"ceiling": null,
"gridLineInterpolation": null,
"gridLineWidth": 1,
"gridLineColor": "#e6e6e6",
"min": 0,
"max": null,
"minorTickInterval": null,
"minorTickWidth": 0,
"minTickInterval": null,
"startOnTick": true,
"endOnTick": true,
"minRange": null,
"type": "linear",
"tickmarkPlacement": null,
"labels": {
"enabled": true,
"formatter": null,
"style": {
"color": "#666666",
"cursor": "default",
"fontSize": "11px"
},
"useHTML": false
}
},
"zAxis": {
"title": {
"text": "Multi Score"
}
},
"plotOptions": {
"series": {
"dataLabels": {
"enabled": false,
"format": null,
"distance": 30,
"align": "center",
"inside": null,
"allowOverlap": false,
"style": {
"fontSize": "11px"
}
},
"showInLegend": null,
"turboThreshold": 0,
"stacking": "",
"groupPadding": 0.2,
"centerInCategory": false,
"findNearestPointBy": "x"
}
},
"navigator": {
"enabled": false
},
"scrollbar": {
"enabled": false
},
"rangeSelector": {
"enabled": false,
"inputEnabled": false
},
"legend": {
"enabled": null,
"maxHeight": null,
"align": "center",
"verticalAlign": "bottom",
"layout": "horizontal",
"width": null,
"margin": 12,
"reversed": false
},
"series": [
{
"name": "ENT1-M by Scaleway",
"color": "#510099",
"data": [
{
"x": 1019.2649281050085,
"y": 11573.340764773868
},
{
"x": 986.5274430709794,
"y": 11827.58815401767
},
{
"x": 968.3071343849575,
"y": 11973.089043903261
},
{
"x": 959.1392546238967,
"y": 11573.590796355
},
{
"x": 993.6615309148651,
"y": 11846.060081451014
},
{
"x": 970.2609991133648,
"y": 11525.8678812559
},
{
"x": 965.118995831765,
"y": 11783.20107034827
},
{
"x": 1053.2148551999508,
"y": 11543.824195598047
},
{
"x": 1030.631308379675,
"y": 11369.402680364601
},
{
"x": 1114.431957684264,
"y": 11860.794574282421
},
{
"x": 966.1608820590227,
"y": 11541.538425885487
},
{
"x": 997.7149234749967,
"y": 11589.262573793152
},
{
"x": 967.5749605489953,
"y": 11497.352819658892
},
{
"x": 991.4841115340491,
"y": 11994.05992885321
},
{
"x": 975.6532983331113,
"y": 11580.370514856504
},
{
"x": 994.6996325142763,
"y": 11835.436011494934
},
{
"x": 1037.631339524743,
"y": 11318.397176277678
},
{
"x": 1011.3999142629834,
"y": 11606.094979783687
},
{
"x": 1005.7523953526112,
"y": 11648.237505016303
},
{
"x": 1108.223478438188,
"y": 11895.599263508642
}
]
}
],
"drilldown": {},
"tooltip": {
"enabled": true,
"useHTML": false,
"format": null,
"headerFormat": "",
"pointFormat": "<span style=\"color:{series.color}\">Single</span>: <b>{point.x:.0f}</b><br><span style=\"color:{series.color}\">Multi</span>: <b>{point.y:.0f}</b>",
"footerFormat": "",
"shared": false,
"outside": false,
"valueDecimals": null,
"split": false
},
"annotations": null
},
"hc_type": "chart",
"id": "6466216655708894556027970036990456249"
}
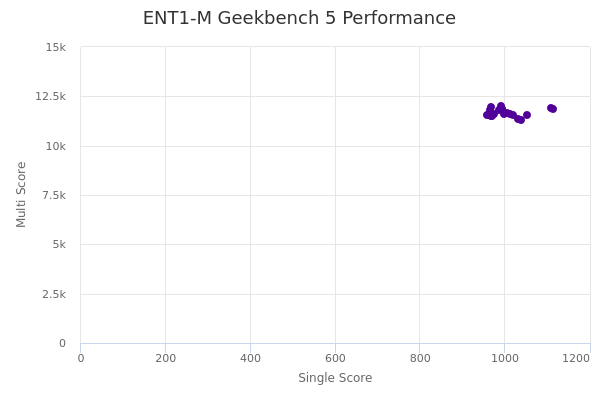
| Single | Multi | |
|---|---|---|
| Max | 1114 | 11994 |
| Average | 1006 | 11669 |
| Deviation | 43.44 | 189.06 |
| Min | 959 | 11318 |