EM-A210R-HDD by Scaleway
Geekbench is a cross-platform processor benchmark with a scoring system that determines single-core and multi-core performance using loads simulating real-world scenarios. Geekbench 5 score is calculated with a reference score of 2500 representing the performance of the Intel Core i5-2520M @ 2.50 GHz. The software benchmark is available for Mac OS, Windows, Linux, Android and iOS platforms.
Specifications:
CPU
12
RAM
14.9 GB
Root
1000 GB
HDD
Extra
1x
1000 GB
N/A
Net
976562 Mbps
{
"configuration": {
"chart": {
"type": "scatter",
"polar": false,
"zoomType": "",
"options3d": {},
"height": null,
"width": null,
"margin": null,
"inverted": false,
"zooming": {}
},
"credits": {
"enabled": false
},
"title": {
"text": ""
},
"colorAxis": null,
"subtitle": {
"text": ""
},
"xAxis": {
"title": {
"text": [
"Single Score"
],
"useHTML": false,
"style": {
"color": "#666666"
}
},
"categories": null,
"lineWidth": 1,
"tickInterval": null,
"tickWidth": 1,
"tickLength": 10,
"tickPixelInterval": 100,
"plotLines": null,
"labels": {
"enabled": true,
"format": null,
"formatter": "",
"style": {
"color": "#666666",
"cursor": "default",
"fontSize": "11px"
},
"useHTML": false,
"step": 0
},
"plotBands": null,
"visible": true,
"floor": null,
"ceiling": null,
"type": "linear",
"min": 0,
"gridLineWidth": 1,
"gridLineColor": "#e6e6e6",
"minorTickInterval": null,
"minorTickWidth": 0,
"minTickInterval": null,
"startOnTick": true,
"endOnTick": true,
"tickmarkPlacement": 100,
"units": 100,
"minRange": 100
},
"yAxis": {
"title": {
"text": [
"Multi Score"
],
"useHTML": false,
"style": {
"color": "#666666"
}
},
"categories": null,
"plotLines": null,
"plotBands": null,
"lineWidth": null,
"tickInterval": null,
"tickLength": 10,
"floor": null,
"ceiling": null,
"gridLineInterpolation": null,
"gridLineWidth": 1,
"gridLineColor": "#e6e6e6",
"min": 0,
"max": null,
"minorTickInterval": null,
"minorTickWidth": 0,
"minTickInterval": null,
"startOnTick": true,
"endOnTick": true,
"minRange": null,
"type": "linear",
"tickmarkPlacement": null,
"labels": {
"enabled": true,
"formatter": null,
"style": {
"color": "#666666",
"cursor": "default",
"fontSize": "11px"
},
"useHTML": false
}
},
"zAxis": {
"title": {
"text": "Multi Score"
}
},
"plotOptions": {
"series": {
"dataLabels": {
"enabled": false,
"format": null,
"distance": 30,
"align": "center",
"inside": null,
"allowOverlap": false,
"style": {
"fontSize": "11px"
}
},
"showInLegend": null,
"turboThreshold": 0,
"stacking": "",
"groupPadding": 0.2,
"centerInCategory": false,
"findNearestPointBy": "x"
}
},
"navigator": {
"enabled": false
},
"scrollbar": {
"enabled": false
},
"rangeSelector": {
"enabled": false,
"inputEnabled": false
},
"legend": {
"enabled": null,
"maxHeight": null,
"align": "center",
"verticalAlign": "bottom",
"layout": "horizontal",
"width": null,
"margin": 12,
"reversed": false
},
"series": [
{
"name": "EM-A210R-HDD by Scaleway",
"color": "#510099",
"data": [
{
"x": 1319.3268790374657,
"y": 7287.261214011881
},
{
"x": 1326.1716777799259,
"y": 7256.554611487143
},
{
"x": 1322.784752634381,
"y": 7281.321280960938
},
{
"x": 1323.6838627697862,
"y": 7265.306179539086
},
{
"x": 1322.3506807428487,
"y": 7251.2532958177035
},
{
"x": 1325.309257754797,
"y": 7276.692156648998
},
{
"x": 1325.2235677734218,
"y": 7290.566749569367
},
{
"x": 1319.7255795233696,
"y": 7288.34952419366
},
{
"x": 1328.9113299925907,
"y": 7253.33153163328
},
{
"x": 1324.723051365598,
"y": 7266.7128027699355
},
{
"x": 1325.0568195608887,
"y": 7292.42481910047
},
{
"x": 1325.8184767205105,
"y": 7291.342376833907
},
{
"x": 1325.2096283369149,
"y": 7315.7329730006295
},
{
"x": 1328.6566063633418,
"y": 7296.6527770475695
},
{
"x": 1317.2187118301513,
"y": 7307.350571601855
},
{
"x": 1319.8982051999021,
"y": 7287.963490158036
},
{
"x": 1319.6954353301307,
"y": 7305.6480104324755
},
{
"x": 1321.4711292743466,
"y": 7287.869339313474
},
{
"x": 1320.3082326111462,
"y": 7292.17840576548
},
{
"x": 1331.2735224650407,
"y": 7302.209741156385
},
{
"x": 1330.3500712203456,
"y": 7295.925944910086
},
{
"x": 1320.866365652443,
"y": 7308.622759279769
},
{
"x": 1319.5230254781338,
"y": 7299.456995937431
},
{
"x": 1322.7614913188133,
"y": 7303.665385995249
},
{
"x": 1307.211018997683,
"y": 7316.221729598556
},
{
"x": 1320.4683542085572,
"y": 7298.722340967375
},
{
"x": 1330.1969116768921,
"y": 7272.1099425561115
},
{
"x": 1327.2483435905224,
"y": 7278.047159585787
},
{
"x": 1327.1750178847622,
"y": 7307.869764513445
},
{
"x": 1317.8198298321593,
"y": 7291.837689042673
}
]
}
],
"drilldown": {},
"tooltip": {
"enabled": true,
"useHTML": false,
"format": null,
"headerFormat": "",
"pointFormat": "<span style=\"color:{series.color}\">Single</span>: <b>{point.x:.0f}</b><br><span style=\"color:{series.color}\">Multi</span>: <b>{point.y:.0f}</b>",
"footerFormat": "",
"shared": false,
"outside": false,
"valueDecimals": null,
"split": false
},
"annotations": null
},
"hc_type": "chart",
"id": "51555705970973545132130624369799669881"
}
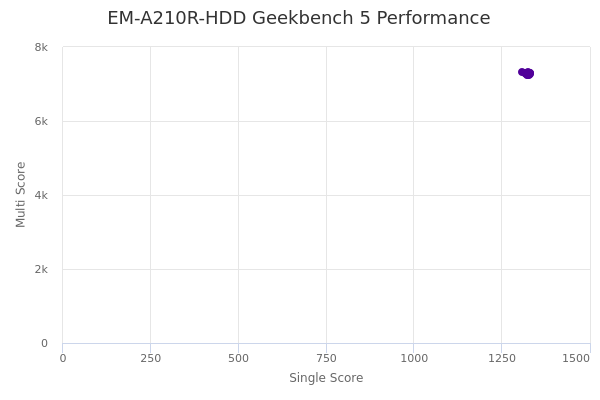
| Single | Multi | |
|---|---|---|
| Max | 1331 | 7316 |
| Average | 1323 | 7289 |
| Deviation | 4.84 | 17.30 |
| Min | 1307 | 7251 |
Sign up as Freemium to get more insight.