cc3.xlarge.4 by Orange Business
Geekbench is a cross-platform processor benchmark with a scoring system that determines single-core and multi-core performance using loads simulating real-world scenarios. Geekbench 5 score is calculated with a reference score of 2500 representing the performance of the Intel Core i5-2520M @ 2.50 GHz. The software benchmark is available for Mac OS, Windows, Linux, Android and iOS platforms.
Specifications:
CPU
4
RAM
16.0 GB
{
"configuration": {
"chart": {
"type": "scatter",
"polar": false,
"zoomType": "",
"options3d": {},
"height": null,
"width": null,
"margin": null,
"inverted": false,
"zooming": {}
},
"credits": {
"enabled": false
},
"title": {
"text": ""
},
"colorAxis": null,
"subtitle": {
"text": ""
},
"xAxis": {
"title": {
"text": [
"Single Score"
],
"useHTML": false,
"style": {
"color": "#666666"
}
},
"categories": null,
"lineWidth": 1,
"tickInterval": null,
"tickWidth": 1,
"tickLength": 10,
"tickPixelInterval": 100,
"plotLines": null,
"labels": {
"enabled": true,
"format": null,
"formatter": "",
"style": {
"color": "#666666",
"cursor": "default",
"fontSize": "11px"
},
"useHTML": false,
"step": 0
},
"plotBands": null,
"visible": true,
"floor": null,
"ceiling": null,
"type": "linear",
"min": 0,
"gridLineWidth": 1,
"gridLineColor": "#e6e6e6",
"minorTickInterval": null,
"minorTickWidth": 0,
"minTickInterval": null,
"startOnTick": true,
"endOnTick": true,
"tickmarkPlacement": 100,
"units": 100,
"minRange": 100
},
"yAxis": {
"title": {
"text": [
"Multi Score"
],
"useHTML": false,
"style": {
"color": "#666666"
}
},
"categories": null,
"plotLines": null,
"plotBands": null,
"lineWidth": null,
"tickInterval": null,
"tickLength": 10,
"floor": null,
"ceiling": null,
"gridLineInterpolation": null,
"gridLineWidth": 1,
"gridLineColor": "#e6e6e6",
"min": 0,
"max": null,
"minorTickInterval": null,
"minorTickWidth": 0,
"minTickInterval": null,
"startOnTick": true,
"endOnTick": true,
"minRange": null,
"type": "linear",
"tickmarkPlacement": null,
"labels": {
"enabled": true,
"formatter": null,
"style": {
"color": "#666666",
"cursor": "default",
"fontSize": "11px"
},
"useHTML": false
}
},
"zAxis": {
"title": {
"text": "Multi Score"
}
},
"plotOptions": {
"series": {
"dataLabels": {
"enabled": false,
"format": null,
"distance": 30,
"align": "center",
"inside": null,
"allowOverlap": false,
"style": {
"fontSize": "11px"
}
},
"showInLegend": null,
"turboThreshold": 0,
"stacking": "",
"groupPadding": 0.2,
"centerInCategory": false,
"findNearestPointBy": "x"
}
},
"navigator": {
"enabled": false
},
"scrollbar": {
"enabled": false
},
"rangeSelector": {
"enabled": false,
"inputEnabled": false
},
"legend": {
"enabled": null,
"maxHeight": null,
"align": "center",
"verticalAlign": "bottom",
"layout": "horizontal",
"width": null,
"margin": 12,
"reversed": false
},
"series": [
{
"name": "cc3.xlarge.4 by Orange Business",
"color": "#fa6600",
"data": [
{
"x": 791.5858718581179,
"y": 1862.0387515310463
},
{
"x": 784.3693547820437,
"y": 1848.5866076094565
},
{
"x": 789.3328209012573,
"y": 1859.6486647487418
},
{
"x": 780.9029661570268,
"y": 1846.5025199388651
},
{
"x": 785.885521468544,
"y": 1857.5726356474092
},
{
"x": 784.882780672526,
"y": 1852.6882342398824
},
{
"x": 789.2273552340077,
"y": 1856.7470948852633
},
{
"x": 782.4115092240136,
"y": 1857.2296605798056
},
{
"x": 792.6031268424724,
"y": 1857.9198585516838
},
{
"x": 784.0573876556012,
"y": 1852.378033467817
},
{
"x": 791.1716341780693,
"y": 1858.6210531467882
},
{
"x": 780.7907373606068,
"y": 1853.393106604112
},
{
"x": 791.2100055245356,
"y": 1858.2232374695395
},
{
"x": 782.969710868157,
"y": 1854.8582499019467
},
{
"x": 790.768985381543,
"y": 1858.6174198630665
},
{
"x": 780.8323544912132,
"y": 1852.8397957525683
},
{
"x": 789.9268116188227,
"y": 1858.3661686570686
},
{
"x": 782.6926178267963,
"y": 1852.7112610185336
},
{
"x": 789.7707758160111,
"y": 1855.096414351111
},
{
"x": 782.1771779532011,
"y": 1852.4984822733823
}
]
}
],
"drilldown": {},
"tooltip": {
"enabled": true,
"useHTML": false,
"format": null,
"headerFormat": "",
"pointFormat": "<span style=\"color:{series.color}\">Single</span>: <b>{point.x:.0f}</b><br><span style=\"color:{series.color}\">Multi</span>: <b>{point.y:.0f}</b>",
"footerFormat": "",
"shared": false,
"outside": false,
"valueDecimals": null,
"split": false
},
"annotations": null
},
"hc_type": "chart",
"id": "224936414122652943355871797322147915137"
}
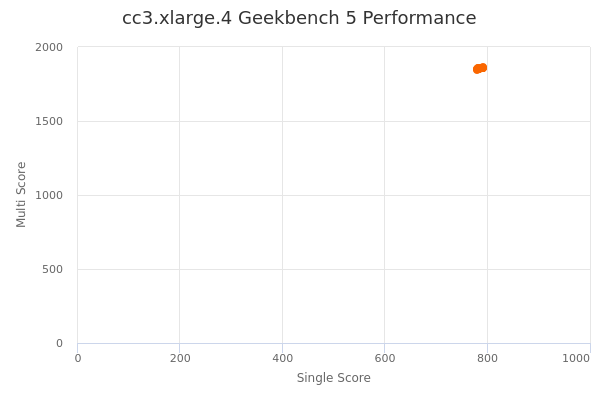
| Single | Multi | |
|---|---|---|
| Max | 793 | 1862 |
| Average | 786 | 1855 |
| Deviation | 4.09 | 3.77 |
| Min | 781 | 1847 |
Sign up as Freemium to get more insight.
- In same series
- cc3.large.4
- cc3.xlarge.4
- cc3.2xlarge.4
- cc3.4xlarge.4
- cc3.8xlarge.4
- cc3.19xlarge.4