cc3.4xlarge.4 by Orange Business
Geekbench is a cross-platform processor benchmark with a scoring system that determines single-core and multi-core performance using loads simulating real-world scenarios. Geekbench 5 score is calculated with a reference score of 2500 representing the performance of the Intel Core i5-2520M @ 2.50 GHz. The software benchmark is available for Mac OS, Windows, Linux, Android and iOS platforms.
Specifications:
CPU
16
RAM
64.0 GB
{
"configuration": {
"chart": {
"type": "scatter",
"polar": false,
"zoomType": "",
"options3d": {},
"height": null,
"width": null,
"margin": null,
"inverted": false,
"zooming": {}
},
"credits": {
"enabled": false
},
"title": {
"text": ""
},
"colorAxis": null,
"subtitle": {
"text": ""
},
"xAxis": {
"title": {
"text": [
"Single Score"
],
"useHTML": false,
"style": {
"color": "#666666"
}
},
"categories": null,
"lineWidth": 1,
"tickInterval": null,
"tickWidth": 1,
"tickLength": 10,
"tickPixelInterval": 100,
"plotLines": null,
"labels": {
"enabled": true,
"format": null,
"formatter": "",
"style": {
"color": "#666666",
"cursor": "default",
"fontSize": "11px"
},
"useHTML": false,
"step": 0
},
"plotBands": null,
"visible": true,
"floor": null,
"ceiling": null,
"type": "linear",
"min": 0,
"gridLineWidth": 1,
"gridLineColor": "#e6e6e6",
"minorTickInterval": null,
"minorTickWidth": 0,
"minTickInterval": null,
"startOnTick": true,
"endOnTick": true,
"tickmarkPlacement": 100,
"units": 100,
"minRange": 100
},
"yAxis": {
"title": {
"text": [
"Multi Score"
],
"useHTML": false,
"style": {
"color": "#666666"
}
},
"categories": null,
"plotLines": null,
"plotBands": null,
"lineWidth": null,
"tickInterval": null,
"tickLength": 10,
"floor": null,
"ceiling": null,
"gridLineInterpolation": null,
"gridLineWidth": 1,
"gridLineColor": "#e6e6e6",
"min": 0,
"max": null,
"minorTickInterval": null,
"minorTickWidth": 0,
"minTickInterval": null,
"startOnTick": true,
"endOnTick": true,
"minRange": null,
"type": "linear",
"tickmarkPlacement": null,
"labels": {
"enabled": true,
"formatter": null,
"style": {
"color": "#666666",
"cursor": "default",
"fontSize": "11px"
},
"useHTML": false
}
},
"zAxis": {
"title": {
"text": "Multi Score"
}
},
"plotOptions": {
"series": {
"dataLabels": {
"enabled": false,
"format": null,
"distance": 30,
"align": "center",
"inside": null,
"allowOverlap": false,
"style": {
"fontSize": "11px"
}
},
"showInLegend": null,
"turboThreshold": 0,
"stacking": "",
"groupPadding": 0.2,
"centerInCategory": false,
"findNearestPointBy": "x"
}
},
"navigator": {
"enabled": false
},
"scrollbar": {
"enabled": false
},
"rangeSelector": {
"enabled": false,
"inputEnabled": false
},
"legend": {
"enabled": null,
"maxHeight": null,
"align": "center",
"verticalAlign": "bottom",
"layout": "horizontal",
"width": null,
"margin": 12,
"reversed": false
},
"series": [
{
"name": "cc3.4xlarge.4 by Orange Business",
"color": "#fa6600",
"data": [
{
"x": 768.2609797029932,
"y": 6786.020568619628
},
{
"x": 760.8700085118319,
"y": 6641.42965965497
},
{
"x": 774.2525554841443,
"y": 6568.234984717241
},
{
"x": 773.8478680267635,
"y": 6737.93794918499
},
{
"x": 774.93786779287,
"y": 6657.228695705002
},
{
"x": 770.8019822456395,
"y": 6730.108981778141
},
{
"x": 770.4238658490735,
"y": 6704.774592268138
},
{
"x": 764.9235424399327,
"y": 6584.297319682395
},
{
"x": 775.6084334486375,
"y": 6754.958971433305
},
{
"x": 770.791366493782,
"y": 6644.239796567685
},
{
"x": 773.3273434001779,
"y": 6687.925399636066
},
{
"x": 767.242970418198,
"y": 6709.192625422356
},
{
"x": 773.959320085429,
"y": 6748.823810089084
},
{
"x": 775.1266128272816,
"y": 6612.358856894138
},
{
"x": 765.4973615236511,
"y": 6725.717332331125
},
{
"x": 773.893480499095,
"y": 6738.9500480112765
},
{
"x": 773.674395631618,
"y": 6733.250964360306
},
{
"x": 763.0420555569489,
"y": 6592.589775063363
},
{
"x": 772.3482955100712,
"y": 6720.539242384732
},
{
"x": 762.3414292087218,
"y": 6693.525320144528
}
]
}
],
"drilldown": {},
"tooltip": {
"enabled": true,
"useHTML": false,
"format": null,
"headerFormat": "",
"pointFormat": "<span style=\"color:{series.color}\">Single</span>: <b>{point.x:.0f}</b><br><span style=\"color:{series.color}\">Multi</span>: <b>{point.y:.0f}</b>",
"footerFormat": "",
"shared": false,
"outside": false,
"valueDecimals": null,
"split": false
},
"annotations": null
},
"hc_type": "chart",
"id": "110571310506076212457397688336420536792"
}
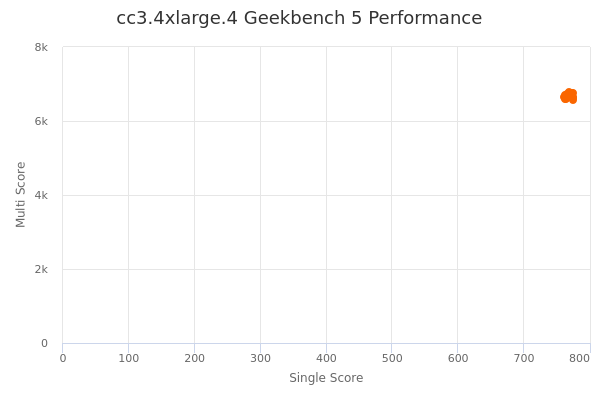
| Single | Multi | |
|---|---|---|
| Max | 776 | 6786 |
| Average | 770 | 6689 |
| Deviation | 4.60 | 61.19 |
| Min | 761 | 6568 |
Sign up as Freemium to get more insight.
- In same series
- cc3.large.4
- cc3.xlarge.4
- cc3.2xlarge.4
- cc3.4xlarge.4
- cc3.8xlarge.4
- cc3.19xlarge.4