cc3.8xlarge.4 by Orange Business
Geekbench is a cross-platform processor benchmark with a scoring system that determines single-core and multi-core performance using loads simulating real-world scenarios. Geekbench 5 score is calculated with a reference score of 2500 representing the performance of the Intel Core i5-2520M @ 2.50 GHz. The software benchmark is available for Mac OS, Windows, Linux, Android and iOS platforms.
Specifications:
CPU
32
RAM
128.0 GB
{
"configuration": {
"chart": {
"type": "scatter",
"polar": false,
"zoomType": "",
"options3d": {},
"height": null,
"width": null,
"margin": null,
"inverted": false,
"zooming": {}
},
"credits": {
"enabled": false
},
"title": {
"text": ""
},
"colorAxis": null,
"subtitle": {
"text": ""
},
"xAxis": {
"title": {
"text": [
"Single Score"
],
"useHTML": false,
"style": {
"color": "#666666"
}
},
"categories": null,
"lineWidth": 1,
"tickInterval": null,
"tickWidth": 1,
"tickLength": 10,
"tickPixelInterval": 100,
"plotLines": null,
"labels": {
"enabled": true,
"format": null,
"formatter": "",
"style": {
"color": "#666666",
"cursor": "default",
"fontSize": "11px"
},
"useHTML": false,
"step": 0
},
"plotBands": null,
"visible": true,
"floor": null,
"ceiling": null,
"type": "linear",
"min": 0,
"gridLineWidth": 1,
"gridLineColor": "#e6e6e6",
"minorTickInterval": null,
"minorTickWidth": 0,
"minTickInterval": null,
"startOnTick": true,
"endOnTick": true,
"tickmarkPlacement": 100,
"units": 100,
"minRange": 100
},
"yAxis": {
"title": {
"text": [
"Multi Score"
],
"useHTML": false,
"style": {
"color": "#666666"
}
},
"categories": null,
"plotLines": null,
"plotBands": null,
"lineWidth": null,
"tickInterval": null,
"tickLength": 10,
"floor": null,
"ceiling": null,
"gridLineInterpolation": null,
"gridLineWidth": 1,
"gridLineColor": "#e6e6e6",
"min": 0,
"max": null,
"minorTickInterval": null,
"minorTickWidth": 0,
"minTickInterval": null,
"startOnTick": true,
"endOnTick": true,
"minRange": null,
"type": "linear",
"tickmarkPlacement": null,
"labels": {
"enabled": true,
"formatter": null,
"style": {
"color": "#666666",
"cursor": "default",
"fontSize": "11px"
},
"useHTML": false
}
},
"zAxis": {
"title": {
"text": "Multi Score"
}
},
"plotOptions": {
"series": {
"dataLabels": {
"enabled": false,
"format": null,
"distance": 30,
"align": "center",
"inside": null,
"allowOverlap": false,
"style": {
"fontSize": "11px"
}
},
"showInLegend": null,
"turboThreshold": 0,
"stacking": "",
"groupPadding": 0.2,
"centerInCategory": false,
"findNearestPointBy": "x"
}
},
"navigator": {
"enabled": false
},
"scrollbar": {
"enabled": false
},
"rangeSelector": {
"enabled": false,
"inputEnabled": false
},
"legend": {
"enabled": null,
"maxHeight": null,
"align": "center",
"verticalAlign": "bottom",
"layout": "horizontal",
"width": null,
"margin": 12,
"reversed": false
},
"series": [
{
"name": "cc3.8xlarge.4 by Orange Business",
"color": "#fa6600",
"data": [
{
"x": 782.1346658208362,
"y": 12076.026139682457
},
{
"x": 788.9405667184374,
"y": 11929.209894607324
},
{
"x": 787.3466617284065,
"y": 11952.095507591857
},
{
"x": 782.9863120222536,
"y": 11916.403516382325
},
{
"x": 788.0478004825954,
"y": 11809.760105115194
},
{
"x": 782.454363957607,
"y": 12321.243606907112
},
{
"x": 787.8947397766658,
"y": 11885.100177586832
},
{
"x": 780.1299555301892,
"y": 12091.628902754639
},
{
"x": 780.3722736980625,
"y": 12202.866109742426
},
{
"x": 785.9884706007665,
"y": 12156.675872975891
},
{
"x": 781.4119170457427,
"y": 11922.800794751705
},
{
"x": 789.7996761004266,
"y": 11431.196979190636
},
{
"x": 787.6026484612835,
"y": 12205.071287743653
},
{
"x": 775.6697363328392,
"y": 11752.006151941485
},
{
"x": 791.2480093294168,
"y": 12069.031518755433
},
{
"x": 778.9643663667416,
"y": 12042.62341049362
},
{
"x": 779.7078779746672,
"y": 11858.128331175098
},
{
"x": 787.1393023310519,
"y": 12174.322617159329
},
{
"x": 780.6445241311021,
"y": 11942.471681662293
},
{
"x": 790.0000931499553,
"y": 11948.739762580157
}
]
}
],
"drilldown": {},
"tooltip": {
"enabled": true,
"useHTML": false,
"format": null,
"headerFormat": "",
"pointFormat": "<span style=\"color:{series.color}\">Single</span>: <b>{point.x:.0f}</b><br><span style=\"color:{series.color}\">Multi</span>: <b>{point.y:.0f}</b>",
"footerFormat": "",
"shared": false,
"outside": false,
"valueDecimals": null,
"split": false
},
"annotations": null
},
"hc_type": "chart",
"id": "73098413230431137730838011798320086902"
}
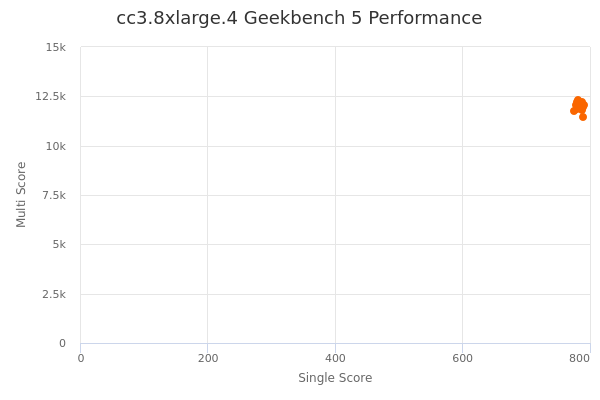
| Single | Multi | |
|---|---|---|
| Max | 791 | 12321 |
| Average | 784 | 11984 |
| Deviation | 4.35 | 192.09 |
| Min | 776 | 11431 |
Sign up as Freemium to get more insight.
- In same series
- cc3.large.4
- cc3.xlarge.4
- cc3.2xlarge.4
- cc3.4xlarge.4
- cc3.8xlarge.4
- cc3.19xlarge.4