VM.Standard.E4.Flex.8-16 by Oracle Cloud
Geekbench is a cross-platform processor benchmark with a scoring system that determines single-core and multi-core performance using loads simulating real-world scenarios. Geekbench 5 score is calculated with a reference score of 2500 representing the performance of the Intel Core i5-2520M @ 2.50 GHz. The software benchmark is available for Mac OS, Windows, Linux, Android and iOS platforms.
Specifications:
CPU
16
RAM
16.0 GB
Net
8000 Mbps
{
"configuration": {
"chart": {
"type": "scatter",
"polar": false,
"zoomType": "",
"options3d": {},
"height": null,
"width": null,
"margin": null,
"inverted": false,
"zooming": {}
},
"credits": {
"enabled": false
},
"title": {
"text": ""
},
"colorAxis": null,
"subtitle": {
"text": ""
},
"xAxis": {
"title": {
"text": [
"Single Score"
],
"useHTML": false,
"style": {
"color": "#666666"
}
},
"categories": null,
"lineWidth": 1,
"tickInterval": null,
"tickWidth": 1,
"tickLength": 10,
"tickPixelInterval": 100,
"plotLines": null,
"labels": {
"enabled": true,
"format": null,
"formatter": "",
"style": {
"color": "#666666",
"cursor": "default",
"fontSize": "11px"
},
"useHTML": false,
"step": 0
},
"plotBands": null,
"visible": true,
"floor": null,
"ceiling": null,
"type": "linear",
"min": 0,
"gridLineWidth": 1,
"gridLineColor": "#e6e6e6",
"minorTickInterval": null,
"minorTickWidth": 0,
"minTickInterval": null,
"startOnTick": true,
"endOnTick": true,
"tickmarkPlacement": 100,
"units": 100,
"minRange": 100
},
"yAxis": {
"title": {
"text": [
"Multi Score"
],
"useHTML": false,
"style": {
"color": "#666666"
}
},
"categories": null,
"plotLines": null,
"plotBands": null,
"lineWidth": null,
"tickInterval": null,
"tickLength": 10,
"floor": null,
"ceiling": null,
"gridLineInterpolation": null,
"gridLineWidth": 1,
"gridLineColor": "#e6e6e6",
"min": 0,
"max": null,
"minorTickInterval": null,
"minorTickWidth": 0,
"minTickInterval": null,
"startOnTick": true,
"endOnTick": true,
"minRange": null,
"type": "linear",
"tickmarkPlacement": null,
"labels": {
"enabled": true,
"formatter": null,
"style": {
"color": "#666666",
"cursor": "default",
"fontSize": "11px"
},
"useHTML": false
}
},
"zAxis": {
"title": {
"text": "Multi Score"
}
},
"plotOptions": {
"series": {
"dataLabels": {
"enabled": false,
"format": null,
"distance": 30,
"align": "center",
"inside": null,
"allowOverlap": false,
"style": {
"fontSize": "11px"
}
},
"showInLegend": null,
"turboThreshold": 0,
"stacking": "",
"groupPadding": 0.2,
"centerInCategory": false,
"findNearestPointBy": "x"
}
},
"navigator": {
"enabled": false
},
"scrollbar": {
"enabled": false
},
"rangeSelector": {
"enabled": false,
"inputEnabled": false
},
"legend": {
"enabled": null,
"maxHeight": null,
"align": "center",
"verticalAlign": "bottom",
"layout": "horizontal",
"width": null,
"margin": 12,
"reversed": false
},
"series": [
{
"name": "VM.Standard.E4.Flex.8-16 by Oracle Cloud",
"color": "#FF0000",
"data": [
{
"x": 1019.5405131128232,
"y": 8767.339702134384
},
{
"x": 1023.85690939255,
"y": 7760.411758136041
},
{
"x": 1018.5029065905883,
"y": 8381.3332539168
},
{
"x": 1026.3904855581472,
"y": 7723.763303566606
},
{
"x": 1008.4464983862372,
"y": 8850.383396667861
},
{
"x": 1017.955730281079,
"y": 7856.559400887187
},
{
"x": 1022.8038640425507,
"y": 8769.540138468525
},
{
"x": 1018.5439507984313,
"y": 7833.605576360337
},
{
"x": 1011.021691045321,
"y": 8831.219192493852
},
{
"x": 1011.4186860672562,
"y": 7748.145581679402
},
{
"x": 1018.8768196676319,
"y": 8897.52827260681
},
{
"x": 1020.8401327926745,
"y": 7391.066409210376
},
{
"x": 980.3216710947385,
"y": 8757.309955318811
},
{
"x": 1011.2264887856863,
"y": 7339.3690910829855
},
{
"x": 982.6675349452537,
"y": 8845.224001900042
},
{
"x": 1010.5094510046476,
"y": 7748.029637405081
},
{
"x": 1017.1822690947108,
"y": 8853.861542179458
},
{
"x": 1019.5391546212704,
"y": 7753.6682727894095
},
{
"x": 1009.4563195238579,
"y": 8844.765251931982
},
{
"x": 1025.036823547811,
"y": 7629.230241732423
}
]
}
],
"drilldown": {},
"tooltip": {
"enabled": true,
"useHTML": false,
"format": null,
"headerFormat": "",
"pointFormat": "<span style=\"color:{series.color}\">Single</span>: <b>{point.x:.0f}</b><br><span style=\"color:{series.color}\">Multi</span>: <b>{point.y:.0f}</b>",
"footerFormat": "",
"shared": false,
"outside": false,
"valueDecimals": null,
"split": false
},
"annotations": null
},
"hc_type": "chart",
"id": "286310809322415123865669276448179409680"
}
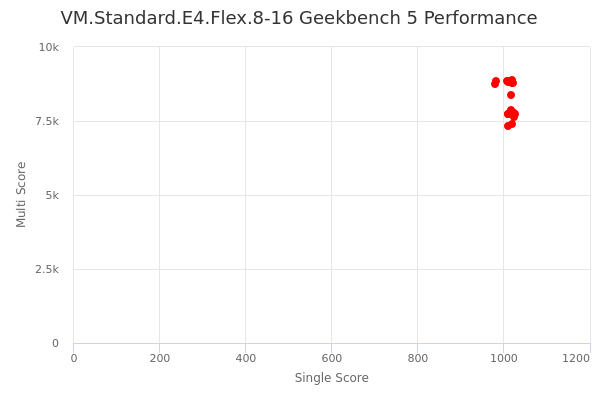
| Single | Multi | |
|---|---|---|
| Max | 1026 | 8898 |
| Average | 1014 | 8229 |
| Deviation | 11.94 | 571.89 |
| Min | 980 | 7339 |
Sign up as Freemium to get more insight.
- In same series
- VM.Standard.E4.Flex.1-1
- VM.Standard.E4.Flex.1-2
- VM.Standard.E4.Flex.1-3
- VM.Standard.E4.Flex.1-4
- VM.Standard.E4.Flex.1-6
- VM.Standard.E4.Flex.1-8
- VM.Standard.E4.Flex.1-12
- VM.Standard.E4.Flex.1-16
- VM.Standard.E4.Flex.1-24
- VM.Standard.E4.Flex.1-32
- VM.Standard.E4.Flex.1-48
- VM.Standard.E4.Flex.1-64
- VM.Standard.E4.Flex.2-2
- VM.Standard.E4.Flex.2-3
- VM.Standard.E4.Flex.2-4
- VM.Standard.E4.Flex.2-6
- VM.Standard.E4.Flex.2-8
- VM.Standard.E4.Flex.2-12
- VM.Standard.E4.Flex.2-16
- VM.Standard.E4.Flex.2-24
- VM.Standard.E4.Flex.2-32
- VM.Standard.E4.Flex.2-48
- VM.Standard.E4.Flex.2-64
- VM.Standard.E4.Flex.2-128
- VM.Standard.E4.Flex.2-192
- VM.Standard.E4.Flex.3-3
- VM.Standard.E4.Flex.3-4
- VM.Standard.E4.Flex.3-6
- VM.Standard.E4.Flex.3-8
- VM.Standard.E4.Flex.3-12
- VM.Standard.E4.Flex.3-16
- VM.Standard.E4.Flex.3-24
- VM.Standard.E4.Flex.3-32
- VM.Standard.E4.Flex.3-48
- VM.Standard.E4.Flex.3-64
- VM.Standard.E4.Flex.3-128
- VM.Standard.E4.Flex.3-192
- VM.Standard.E4.Flex.3-256
- VM.Standard.E4.Flex.4-4
- VM.Standard.E4.Flex.4-6
- VM.Standard.E4.Flex.4-8
- VM.Standard.E4.Flex.4-12
- VM.Standard.E4.Flex.4-16
- VM.Standard.E4.Flex.4-24
- VM.Standard.E4.Flex.4-32
- VM.Standard.E4.Flex.4-48
- VM.Standard.E4.Flex.4-64
- VM.Standard.E4.Flex.4-128
- VM.Standard.E4.Flex.4-192
- VM.Standard.E4.Flex.4-256
- VM.Standard.E4.Flex.4-384
- VM.Standard.E4.Flex.6-6
- VM.Standard.E4.Flex.6-8
- VM.Standard.E4.Flex.6-12
- VM.Standard.E4.Flex.6-16
- VM.Standard.E4.Flex.6-24
- VM.Standard.E4.Flex.6-32
- VM.Standard.E4.Flex.6-48
- VM.Standard.E4.Flex.6-64
- VM.Standard.E4.Flex.6-128
- VM.Standard.E4.Flex.6-192
- VM.Standard.E4.Flex.6-256
- VM.Standard.E4.Flex.6-384
- VM.Standard.E4.Flex.6-512
- VM.Standard.E4.Flex.8-8
- VM.Standard.E4.Flex.8-12
- VM.Standard.E4.Flex.8-16
- VM.Standard.E4.Flex.8-24
- VM.Standard.E4.Flex.8-32
- VM.Standard.E4.Flex.8-48
- VM.Standard.E4.Flex.8-64
- VM.Standard.E4.Flex.8-128
- VM.Standard.E4.Flex.8-192
- VM.Standard.E4.Flex.8-256
- VM.Standard.E4.Flex.8-384
- VM.Standard.E4.Flex.8-512
- VM.Standard.E4.Flex.8-768
- VM.Standard.E4.Flex.12-12
- VM.Standard.E4.Flex.12-16
- VM.Standard.E4.Flex.12-24
- VM.Standard.E4.Flex.12-32
- VM.Standard.E4.Flex.12-48
- VM.Standard.E4.Flex.12-64
- VM.Standard.E4.Flex.12-128
- VM.Standard.E4.Flex.12-192
- VM.Standard.E4.Flex.12-256
- VM.Standard.E4.Flex.12-384
- VM.Standard.E4.Flex.12-512
- VM.Standard.E4.Flex.12-768
- VM.Standard.E4.Flex.12-1024
- VM.Standard.E4.Flex.16-16
- VM.Standard.E4.Flex.16-24
- VM.Standard.E4.Flex.16-32
- VM.Standard.E4.Flex.16-48
- VM.Standard.E4.Flex.16-64
- VM.Standard.E4.Flex.16-128
- VM.Standard.E4.Flex.16-192
- VM.Standard.E4.Flex.16-256
- VM.Standard.E4.Flex.16-384
- VM.Standard.E4.Flex.16-512
- VM.Standard.E4.Flex.16-768
- VM.Standard.E4.Flex.16-1024
- VM.Standard.E4.Flex.24-24
- VM.Standard.E4.Flex.24-32
- VM.Standard.E4.Flex.24-48
- VM.Standard.E4.Flex.24-64
- VM.Standard.E4.Flex.24-128
- VM.Standard.E4.Flex.24-192
- VM.Standard.E4.Flex.24-256
- VM.Standard.E4.Flex.24-384
- VM.Standard.E4.Flex.24-512
- VM.Standard.E4.Flex.24-768
- VM.Standard.E4.Flex.24-1024
- VM.Standard.E4.Flex.32-32
- VM.Standard.E4.Flex.32-48
- VM.Standard.E4.Flex.32-64
- VM.Standard.E4.Flex.32-128
- VM.Standard.E4.Flex.32-192
- VM.Standard.E4.Flex.32-256
- VM.Standard.E4.Flex.32-384
- VM.Standard.E4.Flex.32-512
- VM.Standard.E4.Flex.32-768
- VM.Standard.E4.Flex.32-1024
- VM.Standard.E4.Flex.48-48
- VM.Standard.E4.Flex.48-64
- VM.Standard.E4.Flex.48-128
- VM.Standard.E4.Flex.48-192
- VM.Standard.E4.Flex.48-256
- VM.Standard.E4.Flex.48-384
- VM.Standard.E4.Flex.48-512
- VM.Standard.E4.Flex.48-768
- VM.Standard.E4.Flex.48-1024
- VM.Standard.E4.Flex.64-64
- VM.Standard.E4.Flex.64-128
- VM.Standard.E4.Flex.64-192
- VM.Standard.E4.Flex.64-256
- VM.Standard.E4.Flex.64-384
- VM.Standard.E4.Flex.64-512
- VM.Standard.E4.Flex.64-768
- VM.Standard.E4.Flex.64-1024
- VM.Standard.E4.Flex.80-128
- VM.Standard.E4.Flex.80-192
- VM.Standard.E4.Flex.80-256
- VM.Standard.E4.Flex.80-384
- VM.Standard.E4.Flex.80-512
- VM.Standard.E4.Flex.80-768
- VM.Standard.E4.Flex.80-1024