VM.Standard.E4.Flex.2-16 by Oracle Cloud
Geekbench is a cross-platform processor benchmark with a scoring system that determines single-core and multi-core performance using loads simulating real-world scenarios. Geekbench 5 score is calculated with a reference score of 2500 representing the performance of the Intel Core i5-2520M @ 2.50 GHz. The software benchmark is available for Mac OS, Windows, Linux, Android and iOS platforms.
Specifications:
CPU
4
RAM
16.0 GB
Net
2000 Mbps
{
"configuration": {
"chart": {
"type": "scatter",
"polar": false,
"zoomType": "",
"options3d": {},
"height": null,
"width": null,
"margin": null,
"inverted": false,
"zooming": {}
},
"credits": {
"enabled": false
},
"title": {
"text": ""
},
"colorAxis": null,
"subtitle": {
"text": ""
},
"xAxis": {
"title": {
"text": [
"Single Score"
],
"useHTML": false,
"style": {
"color": "#666666"
}
},
"categories": null,
"lineWidth": 1,
"tickInterval": null,
"tickWidth": 1,
"tickLength": 10,
"tickPixelInterval": 100,
"plotLines": null,
"labels": {
"enabled": true,
"format": null,
"formatter": "",
"style": {
"color": "#666666",
"cursor": "default",
"fontSize": "11px"
},
"useHTML": false,
"step": 0
},
"plotBands": null,
"visible": true,
"floor": null,
"ceiling": null,
"type": "linear",
"min": 0,
"gridLineWidth": 1,
"gridLineColor": "#e6e6e6",
"minorTickInterval": null,
"minorTickWidth": 0,
"minTickInterval": null,
"startOnTick": true,
"endOnTick": true,
"tickmarkPlacement": 100,
"units": 100,
"minRange": 100
},
"yAxis": {
"title": {
"text": [
"Multi Score"
],
"useHTML": false,
"style": {
"color": "#666666"
}
},
"categories": null,
"plotLines": null,
"plotBands": null,
"lineWidth": null,
"tickInterval": null,
"tickLength": 10,
"floor": null,
"ceiling": null,
"gridLineInterpolation": null,
"gridLineWidth": 1,
"gridLineColor": "#e6e6e6",
"min": 0,
"max": null,
"minorTickInterval": null,
"minorTickWidth": 0,
"minTickInterval": null,
"startOnTick": true,
"endOnTick": true,
"minRange": null,
"type": "linear",
"tickmarkPlacement": null,
"labels": {
"enabled": true,
"formatter": null,
"style": {
"color": "#666666",
"cursor": "default",
"fontSize": "11px"
},
"useHTML": false
}
},
"zAxis": {
"title": {
"text": "Multi Score"
}
},
"plotOptions": {
"series": {
"dataLabels": {
"enabled": false,
"format": null,
"distance": 30,
"align": "center",
"inside": null,
"allowOverlap": false,
"style": {
"fontSize": "11px"
}
},
"showInLegend": null,
"turboThreshold": 0,
"stacking": "",
"groupPadding": 0.2,
"centerInCategory": false,
"findNearestPointBy": "x"
}
},
"navigator": {
"enabled": false
},
"scrollbar": {
"enabled": false
},
"rangeSelector": {
"enabled": false,
"inputEnabled": false
},
"legend": {
"enabled": null,
"maxHeight": null,
"align": "center",
"verticalAlign": "bottom",
"layout": "horizontal",
"width": null,
"margin": 12,
"reversed": false
},
"series": [
{
"name": "VM.Standard.E4.Flex.2-16 by Oracle Cloud",
"color": "#FF0000",
"data": [
{
"x": 1024.7715561169969,
"y": 2482.6214275806537
},
{
"x": 936.3291879295678,
"y": 2495.9859084145583
},
{
"x": 1021.1723340868643,
"y": 2481.8220589230764
},
{
"x": 986.8596052060234,
"y": 2500.2387129814056
},
{
"x": 903.5250004090935,
"y": 2476.437714046648
},
{
"x": 999.7154238758941,
"y": 2471.3605753994702
},
{
"x": 920.7278621293694,
"y": 2496.134070038042
},
{
"x": 1023.2219227165948,
"y": 2462.573456265794
},
{
"x": 901.9087659588611,
"y": 2499.1379724351723
},
{
"x": 1029.8873124218753,
"y": 2478.1556019768545
},
{
"x": 915.5880229696603,
"y": 2495.2789771563466
},
{
"x": 1029.2998393814462,
"y": 2502.441996408559
},
{
"x": 1024.8063720009418,
"y": 2479.2714447093335
},
{
"x": 1029.4615825156422,
"y": 2512.3110578895066
},
{
"x": 983.5618109063851,
"y": 2501.783940114756
},
{
"x": 1029.843687525594,
"y": 2482.526043983076
},
{
"x": 914.1559910709839,
"y": 2481.3510658000046
},
{
"x": 1040.624363962976,
"y": 2505.190839030954
},
{
"x": 1026.377245185384,
"y": 2502.0327546447647
},
{
"x": 1028.3749563975693,
"y": 2488.6090524675246
}
]
}
],
"drilldown": {},
"tooltip": {
"enabled": true,
"useHTML": false,
"format": null,
"headerFormat": "",
"pointFormat": "<span style=\"color:{series.color}\">Single</span>: <b>{point.x:.0f}</b><br><span style=\"color:{series.color}\">Multi</span>: <b>{point.y:.0f}</b>",
"footerFormat": "",
"shared": false,
"outside": false,
"valueDecimals": null,
"split": false
},
"annotations": null
},
"hc_type": "chart",
"id": "236506377847654347352529535511254856304"
}
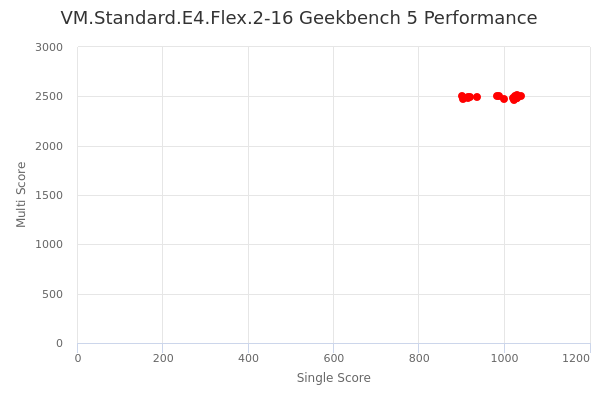
| Single | Multi | |
|---|---|---|
| Max | 1041 | 2512 |
| Average | 989 | 2490 |
| Deviation | 50.22 | 12.74 |
| Min | 902 | 2463 |
Sign up as Freemium to get more insight.
- In same series
- VM.Standard.E4.Flex.1-1
- VM.Standard.E4.Flex.1-2
- VM.Standard.E4.Flex.1-3
- VM.Standard.E4.Flex.1-4
- VM.Standard.E4.Flex.1-6
- VM.Standard.E4.Flex.1-8
- VM.Standard.E4.Flex.1-12
- VM.Standard.E4.Flex.1-16
- VM.Standard.E4.Flex.1-24
- VM.Standard.E4.Flex.1-32
- VM.Standard.E4.Flex.1-48
- VM.Standard.E4.Flex.1-64
- VM.Standard.E4.Flex.2-2
- VM.Standard.E4.Flex.2-3
- VM.Standard.E4.Flex.2-4
- VM.Standard.E4.Flex.2-6
- VM.Standard.E4.Flex.2-8
- VM.Standard.E4.Flex.2-12
- VM.Standard.E4.Flex.2-16
- VM.Standard.E4.Flex.2-24
- VM.Standard.E4.Flex.2-32
- VM.Standard.E4.Flex.2-48
- VM.Standard.E4.Flex.2-64
- VM.Standard.E4.Flex.2-128
- VM.Standard.E4.Flex.2-192
- VM.Standard.E4.Flex.3-3
- VM.Standard.E4.Flex.3-4
- VM.Standard.E4.Flex.3-6
- VM.Standard.E4.Flex.3-8
- VM.Standard.E4.Flex.3-12
- VM.Standard.E4.Flex.3-16
- VM.Standard.E4.Flex.3-24
- VM.Standard.E4.Flex.3-32
- VM.Standard.E4.Flex.3-48
- VM.Standard.E4.Flex.3-64
- VM.Standard.E4.Flex.3-128
- VM.Standard.E4.Flex.3-192
- VM.Standard.E4.Flex.3-256
- VM.Standard.E4.Flex.4-4
- VM.Standard.E4.Flex.4-6
- VM.Standard.E4.Flex.4-8
- VM.Standard.E4.Flex.4-12
- VM.Standard.E4.Flex.4-16
- VM.Standard.E4.Flex.4-24
- VM.Standard.E4.Flex.4-32
- VM.Standard.E4.Flex.4-48
- VM.Standard.E4.Flex.4-64
- VM.Standard.E4.Flex.4-128
- VM.Standard.E4.Flex.4-192
- VM.Standard.E4.Flex.4-256
- VM.Standard.E4.Flex.4-384
- VM.Standard.E4.Flex.6-6
- VM.Standard.E4.Flex.6-8
- VM.Standard.E4.Flex.6-12
- VM.Standard.E4.Flex.6-16
- VM.Standard.E4.Flex.6-24
- VM.Standard.E4.Flex.6-32
- VM.Standard.E4.Flex.6-48
- VM.Standard.E4.Flex.6-64
- VM.Standard.E4.Flex.6-128
- VM.Standard.E4.Flex.6-192
- VM.Standard.E4.Flex.6-256
- VM.Standard.E4.Flex.6-384
- VM.Standard.E4.Flex.6-512
- VM.Standard.E4.Flex.8-8
- VM.Standard.E4.Flex.8-12
- VM.Standard.E4.Flex.8-16
- VM.Standard.E4.Flex.8-24
- VM.Standard.E4.Flex.8-32
- VM.Standard.E4.Flex.8-48
- VM.Standard.E4.Flex.8-64
- VM.Standard.E4.Flex.8-128
- VM.Standard.E4.Flex.8-192
- VM.Standard.E4.Flex.8-256
- VM.Standard.E4.Flex.8-384
- VM.Standard.E4.Flex.8-512
- VM.Standard.E4.Flex.8-768
- VM.Standard.E4.Flex.12-12
- VM.Standard.E4.Flex.12-16
- VM.Standard.E4.Flex.12-24
- VM.Standard.E4.Flex.12-32
- VM.Standard.E4.Flex.12-48
- VM.Standard.E4.Flex.12-64
- VM.Standard.E4.Flex.12-128
- VM.Standard.E4.Flex.12-192
- VM.Standard.E4.Flex.12-256
- VM.Standard.E4.Flex.12-384
- VM.Standard.E4.Flex.12-512
- VM.Standard.E4.Flex.12-768
- VM.Standard.E4.Flex.12-1024
- VM.Standard.E4.Flex.16-16
- VM.Standard.E4.Flex.16-24
- VM.Standard.E4.Flex.16-32
- VM.Standard.E4.Flex.16-48
- VM.Standard.E4.Flex.16-64
- VM.Standard.E4.Flex.16-128
- VM.Standard.E4.Flex.16-192
- VM.Standard.E4.Flex.16-256
- VM.Standard.E4.Flex.16-384
- VM.Standard.E4.Flex.16-512
- VM.Standard.E4.Flex.16-768
- VM.Standard.E4.Flex.16-1024
- VM.Standard.E4.Flex.24-24
- VM.Standard.E4.Flex.24-32
- VM.Standard.E4.Flex.24-48
- VM.Standard.E4.Flex.24-64
- VM.Standard.E4.Flex.24-128
- VM.Standard.E4.Flex.24-192
- VM.Standard.E4.Flex.24-256
- VM.Standard.E4.Flex.24-384
- VM.Standard.E4.Flex.24-512
- VM.Standard.E4.Flex.24-768
- VM.Standard.E4.Flex.24-1024
- VM.Standard.E4.Flex.32-32
- VM.Standard.E4.Flex.32-48
- VM.Standard.E4.Flex.32-64
- VM.Standard.E4.Flex.32-128
- VM.Standard.E4.Flex.32-192
- VM.Standard.E4.Flex.32-256
- VM.Standard.E4.Flex.32-384
- VM.Standard.E4.Flex.32-512
- VM.Standard.E4.Flex.32-768
- VM.Standard.E4.Flex.32-1024
- VM.Standard.E4.Flex.48-48
- VM.Standard.E4.Flex.48-64
- VM.Standard.E4.Flex.48-128
- VM.Standard.E4.Flex.48-192
- VM.Standard.E4.Flex.48-256
- VM.Standard.E4.Flex.48-384
- VM.Standard.E4.Flex.48-512
- VM.Standard.E4.Flex.48-768
- VM.Standard.E4.Flex.48-1024
- VM.Standard.E4.Flex.64-64
- VM.Standard.E4.Flex.64-128
- VM.Standard.E4.Flex.64-192
- VM.Standard.E4.Flex.64-256
- VM.Standard.E4.Flex.64-384
- VM.Standard.E4.Flex.64-512
- VM.Standard.E4.Flex.64-768
- VM.Standard.E4.Flex.64-1024
- VM.Standard.E4.Flex.80-128
- VM.Standard.E4.Flex.80-192
- VM.Standard.E4.Flex.80-256
- VM.Standard.E4.Flex.80-384
- VM.Standard.E4.Flex.80-512
- VM.Standard.E4.Flex.80-768
- VM.Standard.E4.Flex.80-1024