cn1.xsmall by leafcloud
Geekbench is a cross-platform processor benchmark with a scoring system that determines single-core and multi-core performance using loads simulating real-world scenarios. Geekbench 5 score is calculated with a reference score of 2500 representing the performance of the Intel Core i5-2520M @ 2.50 GHz. The software benchmark is available for Mac OS, Windows, Linux, Android and iOS platforms.
Specifications:
CPU
1
RAM
2.0 GB
Root
20 GB
cn1.xsmall Root SSD
{
"configuration": {
"chart": {
"type": "scatter",
"polar": false,
"zoomType": "",
"options3d": {},
"height": null,
"width": null,
"margin": null,
"inverted": false,
"zooming": {}
},
"credits": {
"enabled": false
},
"title": {
"text": ""
},
"colorAxis": null,
"subtitle": {
"text": ""
},
"xAxis": {
"title": {
"text": [
"Single Score"
],
"useHTML": false,
"style": {
"color": "#666666"
}
},
"categories": null,
"lineWidth": 1,
"tickInterval": null,
"tickWidth": 1,
"tickLength": 10,
"tickPixelInterval": 100,
"plotLines": null,
"labels": {
"enabled": true,
"format": null,
"formatter": "",
"style": {
"color": "#666666",
"cursor": "default",
"fontSize": "11px"
},
"useHTML": false,
"step": 0
},
"plotBands": null,
"visible": true,
"floor": null,
"ceiling": null,
"type": "linear",
"min": 0,
"gridLineWidth": 1,
"gridLineColor": "#e6e6e6",
"minorTickInterval": null,
"minorTickWidth": 0,
"minTickInterval": null,
"startOnTick": true,
"endOnTick": true,
"tickmarkPlacement": 100,
"units": 100,
"minRange": 100
},
"yAxis": {
"title": {
"text": [
"Multi Score"
],
"useHTML": false,
"style": {
"color": "#666666"
}
},
"categories": null,
"plotLines": null,
"plotBands": null,
"lineWidth": null,
"tickInterval": null,
"tickLength": 10,
"floor": null,
"ceiling": null,
"gridLineInterpolation": null,
"gridLineWidth": 1,
"gridLineColor": "#e6e6e6",
"min": 0,
"max": null,
"minorTickInterval": null,
"minorTickWidth": 0,
"minTickInterval": null,
"startOnTick": true,
"endOnTick": true,
"minRange": null,
"type": "linear",
"tickmarkPlacement": null,
"labels": {
"enabled": true,
"formatter": null,
"style": {
"color": "#666666",
"cursor": "default",
"fontSize": "11px"
},
"useHTML": false
}
},
"zAxis": {
"title": {
"text": "Multi Score"
}
},
"plotOptions": {
"series": {
"dataLabels": {
"enabled": false,
"format": null,
"distance": 30,
"align": "center",
"inside": null,
"allowOverlap": false,
"style": {
"fontSize": "11px"
}
},
"showInLegend": null,
"turboThreshold": 0,
"stacking": "",
"groupPadding": 0.2,
"centerInCategory": false,
"findNearestPointBy": "x"
}
},
"navigator": {
"enabled": false
},
"scrollbar": {
"enabled": false
},
"rangeSelector": {
"enabled": false,
"inputEnabled": false
},
"legend": {
"enabled": null,
"maxHeight": null,
"align": "center",
"verticalAlign": "bottom",
"layout": "horizontal",
"width": null,
"margin": 12,
"reversed": false
},
"series": [
{
"name": "cn1.xsmall by leafcloud",
"color": "#32f295",
"data": [
{
"x": 683.1088452926928,
"y": 672.9822836419047
},
{
"x": 675.545147654393,
"y": 684.3879862728847
},
{
"x": 692.9378526542545,
"y": 682.8791379642087
},
{
"x": 678.5120141869827,
"y": 679.0016873211754
},
{
"x": 671.4559326527935,
"y": 674.37518116887
},
{
"x": 671.5588997132141,
"y": 677.5590048428942
},
{
"x": 670.7403135750981,
"y": 666.5066201533136
},
{
"x": 666.8829793541332,
"y": 636.4494968903794
},
{
"x": 655.0055775057517,
"y": 657.9698044389497
},
{
"x": 661.844036831329,
"y": 652.7209018216898
},
{
"x": 678.6195229412464,
"y": 688.1543990689092
},
{
"x": 687.2110991365771,
"y": 690.4210986052469
},
{
"x": 686.7799373822056,
"y": 689.206478350336
},
{
"x": 696.4692347692493,
"y": 692.1203529350955
},
{
"x": 692.1161364253019,
"y": 690.7398299788181
},
{
"x": 689.8951704341875,
"y": 692.7819744559228
},
{
"x": 693.5110392625833,
"y": 691.3567990050291
},
{
"x": 685.6635885756549,
"y": 678.813163152094
},
{
"x": 688.5023656587305,
"y": 687.4550544838044
},
{
"x": 682.7822066218932,
"y": 675.8659342532042
}
]
}
],
"drilldown": {},
"tooltip": {
"enabled": true,
"useHTML": false,
"format": null,
"headerFormat": "",
"pointFormat": "<span style=\"color:{series.color}\">Single</span>: <b>{point.x:.0f}</b><br><span style=\"color:{series.color}\">Multi</span>: <b>{point.y:.0f}</b>",
"footerFormat": "",
"shared": false,
"outside": false,
"valueDecimals": null,
"split": false
},
"annotations": null
},
"hc_type": "chart",
"id": "79287826964021716437049243632230155532"
}
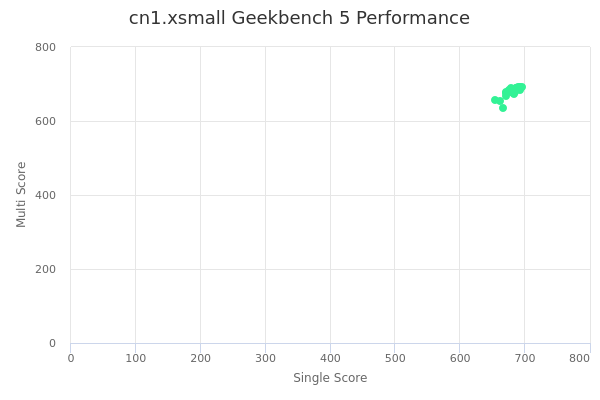
| Single | Multi | |
|---|---|---|
| Max | 696 | 693 |
| Average | 680 | 678 |
| Deviation | 11.09 | 14.56 |
| Min | 655 | 636 |
Sign up as Freemium to get more insight.
- In same series
- cn1.xsmall
- cn1.small
- cn1.medium
- cn1.large
- cn1.xlarge
- cn1.2xlarge
- cn1.3xlarge
- cn1.4xlarge
- cn1.8xlarge