cn1.xlarge by leafcloud
Geekbench is a cross-platform processor benchmark with a scoring system that determines single-core and multi-core performance using loads simulating real-world scenarios. Geekbench 5 score is calculated with a reference score of 2500 representing the performance of the Intel Core i5-2520M @ 2.50 GHz. The software benchmark is available for Mac OS, Windows, Linux, Android and iOS platforms.
Specifications:
CPU
6
RAM
24.0 GB
Root
20 GB
cn1.xlarge Root SSD
{
"configuration": {
"chart": {
"type": "scatter",
"polar": false,
"zoomType": "",
"options3d": {},
"height": null,
"width": null,
"margin": null,
"inverted": false,
"zooming": {}
},
"credits": {
"enabled": false
},
"title": {
"text": ""
},
"colorAxis": null,
"subtitle": {
"text": ""
},
"xAxis": {
"title": {
"text": [
"Single Score"
],
"useHTML": false,
"style": {
"color": "#666666"
}
},
"categories": null,
"lineWidth": 1,
"tickInterval": null,
"tickWidth": 1,
"tickLength": 10,
"tickPixelInterval": 100,
"plotLines": null,
"labels": {
"enabled": true,
"format": null,
"formatter": "",
"style": {
"color": "#666666",
"cursor": "default",
"fontSize": "11px"
},
"useHTML": false,
"step": 0
},
"plotBands": null,
"visible": true,
"floor": null,
"ceiling": null,
"type": "linear",
"min": 0,
"gridLineWidth": 1,
"gridLineColor": "#e6e6e6",
"minorTickInterval": null,
"minorTickWidth": 0,
"minTickInterval": null,
"startOnTick": true,
"endOnTick": true,
"tickmarkPlacement": 100,
"units": 100,
"minRange": 100
},
"yAxis": {
"title": {
"text": [
"Multi Score"
],
"useHTML": false,
"style": {
"color": "#666666"
}
},
"categories": null,
"plotLines": null,
"plotBands": null,
"lineWidth": null,
"tickInterval": null,
"tickLength": 10,
"floor": null,
"ceiling": null,
"gridLineInterpolation": null,
"gridLineWidth": 1,
"gridLineColor": "#e6e6e6",
"min": 0,
"max": null,
"minorTickInterval": null,
"minorTickWidth": 0,
"minTickInterval": null,
"startOnTick": true,
"endOnTick": true,
"minRange": null,
"type": "linear",
"tickmarkPlacement": null,
"labels": {
"enabled": true,
"formatter": null,
"style": {
"color": "#666666",
"cursor": "default",
"fontSize": "11px"
},
"useHTML": false
}
},
"zAxis": {
"title": {
"text": "Multi Score"
}
},
"plotOptions": {
"series": {
"dataLabels": {
"enabled": false,
"format": null,
"distance": 30,
"align": "center",
"inside": null,
"allowOverlap": false,
"style": {
"fontSize": "11px"
}
},
"showInLegend": null,
"turboThreshold": 0,
"stacking": "",
"groupPadding": 0.2,
"centerInCategory": false,
"findNearestPointBy": "x"
}
},
"navigator": {
"enabled": false
},
"scrollbar": {
"enabled": false
},
"rangeSelector": {
"enabled": false,
"inputEnabled": false
},
"legend": {
"enabled": null,
"maxHeight": null,
"align": "center",
"verticalAlign": "bottom",
"layout": "horizontal",
"width": null,
"margin": 12,
"reversed": false
},
"series": [
{
"name": "cn1.xlarge by leafcloud",
"color": "#32f295",
"data": [
{
"x": 694.7261660104784,
"y": 3356.5796330699204
},
{
"x": 677.923725494261,
"y": 3470.8231140670778
},
{
"x": 672.2056122480881,
"y": 3166.5040035581646
},
{
"x": 681.1211951228518,
"y": 3271.1543344456522
},
{
"x": 695.8189528040083,
"y": 3464.576840494888
},
{
"x": 683.4118519782265,
"y": 3404.190907359942
},
{
"x": 694.6702616540006,
"y": 3564.992858954421
},
{
"x": 684.3069058938024,
"y": 3485.877251484996
},
{
"x": 690.2954388324778,
"y": 3617.2138123878544
},
{
"x": 694.2554927712117,
"y": 3588.0773968248827
},
{
"x": 698.9552695088931,
"y": 3562.49037312582
},
{
"x": 689.6378768489191,
"y": 3505.7703122866756
},
{
"x": 682.3622526991461,
"y": 3553.33669069175
},
{
"x": 693.169856866204,
"y": 3528.4011572361946
},
{
"x": 686.9502705125848,
"y": 3520.8513034903826
},
{
"x": 664.4974030961234,
"y": 3546.453603018079
},
{
"x": 689.0849018016958,
"y": 3491.3657550233875
},
{
"x": 693.8114258396035,
"y": 3435.122563141621
},
{
"x": 687.3123896710198,
"y": 3484.046275698376
},
{
"x": 665.5825423498964,
"y": 3552.47598016311
}
]
}
],
"drilldown": {},
"tooltip": {
"enabled": true,
"useHTML": false,
"format": null,
"headerFormat": "",
"pointFormat": "<span style=\"color:{series.color}\">Single</span>: <b>{point.x:.0f}</b><br><span style=\"color:{series.color}\">Multi</span>: <b>{point.y:.0f}</b>",
"footerFormat": "",
"shared": false,
"outside": false,
"valueDecimals": null,
"split": false
},
"annotations": null
},
"hc_type": "chart",
"id": "325756445261966096989286443187631702589"
}
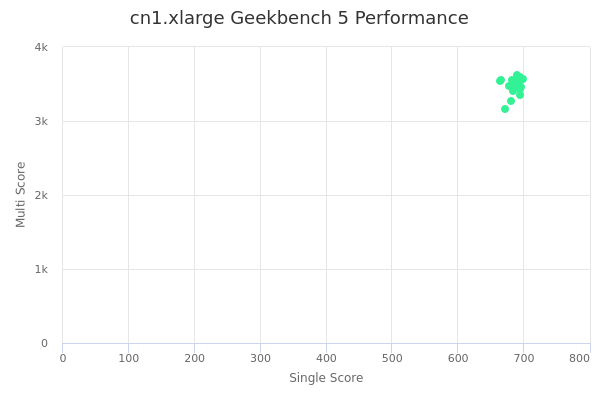
| Single | Multi | |
|---|---|---|
| Max | 699 | 3617 |
| Average | 686 | 3479 |
| Deviation | 9.54 | 107.15 |
| Min | 664 | 3167 |
Sign up as Freemium to get more insight.
- In same series
- cn1.xsmall
- cn1.small
- cn1.medium
- cn1.large
- cn1.xlarge
- cn1.2xlarge
- cn1.3xlarge
- cn1.4xlarge
- cn1.8xlarge