cn1.small by leafcloud
Geekbench is a cross-platform processor benchmark with a scoring system that determines single-core and multi-core performance using loads simulating real-world scenarios. Geekbench 5 score is calculated with a reference score of 2500 representing the performance of the Intel Core i5-2520M @ 2.50 GHz. The software benchmark is available for Mac OS, Windows, Linux, Android and iOS platforms.
Specifications:
CPU
1
RAM
4.0 GB
Root
20 GB
cn1.small Root SSD
{
"configuration": {
"chart": {
"type": "scatter",
"polar": false,
"zoomType": "",
"options3d": {},
"height": null,
"width": null,
"margin": null,
"inverted": false,
"zooming": {}
},
"credits": {
"enabled": false
},
"title": {
"text": ""
},
"colorAxis": null,
"subtitle": {
"text": ""
},
"xAxis": {
"title": {
"text": [
"Single Score"
],
"useHTML": false,
"style": {
"color": "#666666"
}
},
"categories": null,
"lineWidth": 1,
"tickInterval": null,
"tickWidth": 1,
"tickLength": 10,
"tickPixelInterval": 100,
"plotLines": null,
"labels": {
"enabled": true,
"format": null,
"formatter": "",
"style": {
"color": "#666666",
"cursor": "default",
"fontSize": "11px"
},
"useHTML": false,
"step": 0
},
"plotBands": null,
"visible": true,
"floor": null,
"ceiling": null,
"type": "linear",
"min": 0,
"gridLineWidth": 1,
"gridLineColor": "#e6e6e6",
"minorTickInterval": null,
"minorTickWidth": 0,
"minTickInterval": null,
"startOnTick": true,
"endOnTick": true,
"tickmarkPlacement": 100,
"units": 100,
"minRange": 100
},
"yAxis": {
"title": {
"text": [
"Multi Score"
],
"useHTML": false,
"style": {
"color": "#666666"
}
},
"categories": null,
"plotLines": null,
"plotBands": null,
"lineWidth": null,
"tickInterval": null,
"tickLength": 10,
"floor": null,
"ceiling": null,
"gridLineInterpolation": null,
"gridLineWidth": 1,
"gridLineColor": "#e6e6e6",
"min": 0,
"max": null,
"minorTickInterval": null,
"minorTickWidth": 0,
"minTickInterval": null,
"startOnTick": true,
"endOnTick": true,
"minRange": null,
"type": "linear",
"tickmarkPlacement": null,
"labels": {
"enabled": true,
"formatter": null,
"style": {
"color": "#666666",
"cursor": "default",
"fontSize": "11px"
},
"useHTML": false
}
},
"zAxis": {
"title": {
"text": "Multi Score"
}
},
"plotOptions": {
"series": {
"dataLabels": {
"enabled": false,
"format": null,
"distance": 30,
"align": "center",
"inside": null,
"allowOverlap": false,
"style": {
"fontSize": "11px"
}
},
"showInLegend": null,
"turboThreshold": 0,
"stacking": "",
"groupPadding": 0.2,
"centerInCategory": false,
"findNearestPointBy": "x"
}
},
"navigator": {
"enabled": false
},
"scrollbar": {
"enabled": false
},
"rangeSelector": {
"enabled": false,
"inputEnabled": false
},
"legend": {
"enabled": null,
"maxHeight": null,
"align": "center",
"verticalAlign": "bottom",
"layout": "horizontal",
"width": null,
"margin": 12,
"reversed": false
},
"series": [
{
"name": "cn1.small by leafcloud",
"color": "#32f295",
"data": [
{
"x": 679.0359296127264,
"y": 675.047690909232
},
{
"x": 668.7003118629295,
"y": 674.9435449993905
},
{
"x": 692.0474281200576,
"y": 690.4031739871948
},
{
"x": 699.1889086258965,
"y": 681.158097535867
},
{
"x": 688.0186880411447,
"y": 686.5765104001164
},
{
"x": 681.9764383467445,
"y": 679.6612523231342
},
{
"x": 679.9505995507315,
"y": 671.6778364939237
},
{
"x": 679.5935029270614,
"y": 659.9430630342382
},
{
"x": 688.2433259166754,
"y": 687.6588389341699
},
{
"x": 672.9267910858355,
"y": 683.2878248073878
},
{
"x": 690.4669169924589,
"y": 689.2830989284884
},
{
"x": 679.9437294777238,
"y": 681.6894044888606
},
{
"x": 685.0934435966109,
"y": 687.0651721683422
},
{
"x": 678.763416279103,
"y": 690.471832108669
},
{
"x": 680.8492883038373,
"y": 684.9596320213907
},
{
"x": 683.171411845783,
"y": 680.3797042967428
},
{
"x": 681.2851162723219,
"y": 682.8463696204552
},
{
"x": 669.9934488842749,
"y": 672.6146092135
},
{
"x": 687.7613483260975,
"y": 691.2164787974205
},
{
"x": 675.2841784121108,
"y": 664.7677617713573
}
]
}
],
"drilldown": {},
"tooltip": {
"enabled": true,
"useHTML": false,
"format": null,
"headerFormat": "",
"pointFormat": "<span style=\"color:{series.color}\">Single</span>: <b>{point.x:.0f}</b><br><span style=\"color:{series.color}\">Multi</span>: <b>{point.y:.0f}</b>",
"footerFormat": "",
"shared": false,
"outside": false,
"valueDecimals": null,
"split": false
},
"annotations": null
},
"hc_type": "chart",
"id": "133522364404994143304326003295909825955"
}
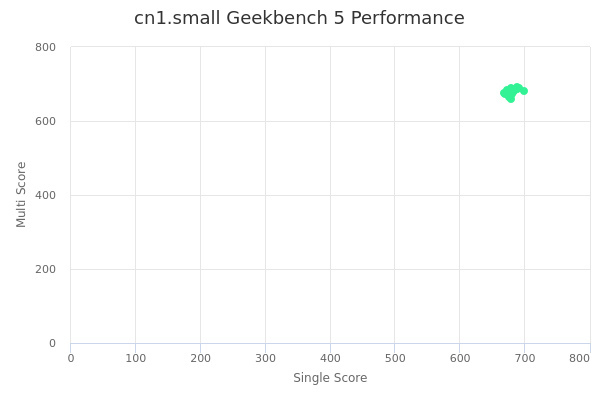
| Single | Multi | |
|---|---|---|
| Max | 699 | 691 |
| Average | 682 | 681 |
| Deviation | 7.32 | 8.44 |
| Min | 669 | 660 |
Sign up as Freemium to get more insight.
- In same series
- cn1.xsmall
- cn1.small
- cn1.medium
- cn1.large
- cn1.xlarge
- cn1.2xlarge
- cn1.3xlarge
- cn1.4xlarge
- cn1.8xlarge