a8-ram32-disk50-perf1 by infomaniak
Geekbench is a cross-platform processor benchmark with a scoring system that determines single-core and multi-core performance using loads simulating real-world scenarios. Geekbench 5 score is calculated with a reference score of 2500 representing the performance of the Intel Core i5-2520M @ 2.50 GHz. The software benchmark is available for Mac OS, Windows, Linux, Android and iOS platforms.
Specifications:
CPU
8
RAM
32.0 GB
Root
50 GB
Root disk
{
"configuration": {
"chart": {
"type": "scatter",
"polar": false,
"zoomType": "",
"options3d": {},
"height": null,
"width": null,
"margin": null,
"inverted": false,
"zooming": {}
},
"credits": {
"enabled": false
},
"title": {
"text": ""
},
"colorAxis": null,
"subtitle": {
"text": ""
},
"xAxis": {
"title": {
"text": [
"Single Score"
],
"useHTML": false,
"style": {
"color": "#666666"
}
},
"categories": null,
"lineWidth": 1,
"tickInterval": null,
"tickWidth": 1,
"tickLength": 10,
"tickPixelInterval": 100,
"plotLines": null,
"labels": {
"enabled": true,
"format": null,
"formatter": "",
"style": {
"color": "#666666",
"cursor": "default",
"fontSize": "11px"
},
"useHTML": false,
"step": 0
},
"plotBands": null,
"visible": true,
"floor": null,
"ceiling": null,
"type": "linear",
"min": 0,
"gridLineWidth": 1,
"gridLineColor": "#e6e6e6",
"minorTickInterval": null,
"minorTickWidth": 0,
"minTickInterval": null,
"startOnTick": true,
"endOnTick": true,
"tickmarkPlacement": 100,
"units": 100,
"minRange": 100
},
"yAxis": {
"title": {
"text": [
"Multi Score"
],
"useHTML": false,
"style": {
"color": "#666666"
}
},
"categories": null,
"plotLines": null,
"plotBands": null,
"lineWidth": null,
"tickInterval": null,
"tickLength": 10,
"floor": null,
"ceiling": null,
"gridLineInterpolation": null,
"gridLineWidth": 1,
"gridLineColor": "#e6e6e6",
"min": 0,
"max": null,
"minorTickInterval": null,
"minorTickWidth": 0,
"minTickInterval": null,
"startOnTick": true,
"endOnTick": true,
"minRange": null,
"type": "linear",
"tickmarkPlacement": null,
"labels": {
"enabled": true,
"formatter": null,
"style": {
"color": "#666666",
"cursor": "default",
"fontSize": "11px"
},
"useHTML": false
}
},
"zAxis": {
"title": {
"text": "Multi Score"
}
},
"plotOptions": {
"series": {
"dataLabels": {
"enabled": false,
"format": null,
"distance": 30,
"align": "center",
"inside": null,
"allowOverlap": false,
"style": {
"fontSize": "11px"
}
},
"showInLegend": null,
"turboThreshold": 0,
"stacking": "",
"groupPadding": 0.2,
"centerInCategory": false,
"findNearestPointBy": "x"
}
},
"navigator": {
"enabled": false
},
"scrollbar": {
"enabled": false
},
"rangeSelector": {
"enabled": false,
"inputEnabled": false
},
"legend": {
"enabled": null,
"maxHeight": null,
"align": "center",
"verticalAlign": "bottom",
"layout": "horizontal",
"width": null,
"margin": 12,
"reversed": false
},
"series": [
{
"name": "a8-ram32-disk50-perf1 by infomaniak",
"color": "#0098FF",
"data": [
{
"x": 1030.2439832768082,
"y": 6567.720645100439
},
{
"x": 1011.2085962736294,
"y": 7009.726159999711
},
{
"x": 1022.3355931029023,
"y": 6983.868616579641
},
{
"x": 1021.6811552642375,
"y": 6572.38931436928
},
{
"x": 1002.1012422209515,
"y": 6722.558526193745
},
{
"x": 994.1254647475137,
"y": 6572.646162471052
},
{
"x": 970.1048133887386,
"y": 6911.061172757336
},
{
"x": 1012.7246504611139,
"y": 6747.731409316051
},
{
"x": 1005.1936044142965,
"y": 6683.936192875349
},
{
"x": 1020.5796864880044,
"y": 6497.28866359785
},
{
"x": 1026.0980311950705,
"y": 6757.2971321666155
},
{
"x": 976.2609160802604,
"y": 6283.369306676383
},
{
"x": 929.4918963662321,
"y": 6281.226097856632
},
{
"x": 980.7169233604052,
"y": 5865.57929598992
},
{
"x": 999.505333297669,
"y": 5589.105892134328
},
{
"x": 1010.6377694735623,
"y": 6188.702579848031
},
{
"x": 999.5544989755626,
"y": 5886.7436254441545
},
{
"x": 983.6768293265355,
"y": 5579.976045641319
},
{
"x": 991.3295337515531,
"y": 5546.5784256565985
},
{
"x": 944.1244523235116,
"y": 5964.71921320476
}
]
}
],
"drilldown": {},
"tooltip": {
"enabled": true,
"useHTML": false,
"format": null,
"headerFormat": "",
"pointFormat": "<span style=\"color:{series.color}\">Single</span>: <b>{point.x:.0f}</b><br><span style=\"color:{series.color}\">Multi</span>: <b>{point.y:.0f}</b>",
"footerFormat": "",
"shared": false,
"outside": false,
"valueDecimals": null,
"split": false
},
"annotations": null
},
"hc_type": "chart",
"id": "68300213728405815989982074992903303955"
}
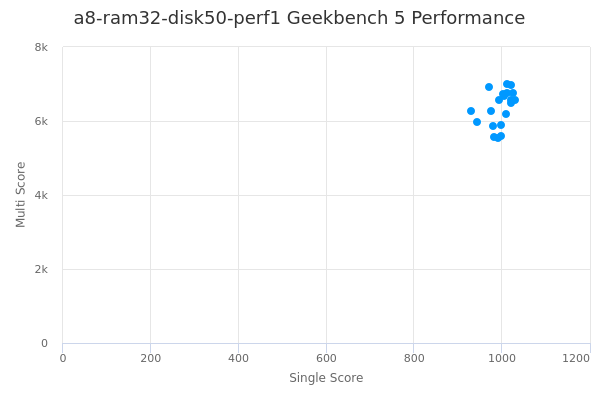
| Single | Multi | |
|---|---|---|
| Max | 1030 | 7010 |
| Average | 997 | 6361 |
| Deviation | 25.97 | 465.96 |
| Min | 929 | 5547 |
Sign up as Freemium to get more insight.
- In same series
- a1-ram2-disk0
- a1-ram2-disk20-perf1
- a1-ram2-disk50-perf1
- a1-ram2-disk80-perf1
- a2-ram4-disk0
- a2-ram4-disk20-perf1
- a2-ram4-disk50-perf1
- a2-ram4-disk80-perf1
- a4-ram8-disk0
- a4-ram8-disk20-perf1
- a4-ram8-disk20-perf2
- a4-ram8-disk50-perf1
- a4-ram8-disk50-perf2
- a4-ram8-disk80-perf1
- a4-ram8-disk80-perf2
- nvl4-a4-ram8-disk0
- nvl4-a4-ram8-disk50-perf1
- nvl4-a4-ram8-disk50-perf2
- nvl4-a4-ram8-disk80-perf1
- nvl4-a4-ram8-disk80-perf2
- a4-ram16-disk0
- a4-ram16-disk20-perf1
- a4-ram16-disk20-perf2
- a4-ram16-disk50-perf1
- a4-ram16-disk50-perf2
- a4-ram16-disk80-perf1
- a4-ram16-disk80-perf2
- a8-ram16-disk0
- a8-ram16-disk20-perf1
- a8-ram16-disk20-perf2
- a8-ram16-disk50-perf1
- a8-ram16-disk50-perf2
- a8-ram16-disk80-perf1
- a8-ram16-disk80-perf2
- nvl4-a8-ram16-disk0
- nvl4-a8-ram16-disk50-perf1
- nvl4-a8-ram16-disk50-perf2
- nvl4-a8-ram16-disk80-perf1
- nvl4-a8-ram16-disk80-perf2
- a8-ram32-disk0
- a8-ram32-disk20-perf1
- a8-ram32-disk20-perf2
- a8-ram32-disk50-perf1
- a8-ram32-disk50-perf2
- a8-ram32-disk80-perf1
- a8-ram32-disk80-perf2
- a12-ram24-disk0
- a12-ram24-disk20-perf1
- a12-ram24-disk20-perf2
- a12-ram24-disk50-perf1
- a12-ram24-disk50-perf2
- a12-ram24-disk80-perf1
- a12-ram24-disk80-perf2
- nvl4-a12-ram24-disk0
- nvl4-a12-ram24-disk50-perf1
- nvl4-a12-ram24-disk50-perf2
- nvl4-a12-ram24-disk80-perf1
- nvl4-a12-ram24-disk80-perf2
- a12-ram48-disk0
- a12-ram48-disk20-perf1
- a12-ram48-disk20-perf2
- a12-ram48-disk50-perf1
- a12-ram48-disk50-perf2
- a12-ram48-disk80-perf1
- a12-ram48-disk80-perf2
- a16-ram32-disk0
- a16-ram32-disk20-perf1
- a16-ram32-disk20-perf2
- a16-ram32-disk50-perf1
- a16-ram32-disk50-perf2
- a16-ram32-disk80-perf1
- a16-ram32-disk80-perf2
- nvl4-a16-ram32-disk0
- nvl4-a16-ram32-disk50-perf1
- nvl4-a16-ram32-disk50-perf2
- nvl4-a16-ram32-disk80-perf1
- nvl4-a16-ram32-disk80-perf2
- a16-ram64-disk0
- a16-ram64-disk20-perf1
- a16-ram64-disk20-perf2
- a16-ram64-disk50-perf1
- a16-ram64-disk50-perf2
- a16-ram64-disk80-perf1
- a16-ram64-disk80-perf2
- a24-ram48-disk0
- a24-ram48-disk20-perf1
- a24-ram48-disk20-perf2
- a24-ram48-disk50-perf1
- a24-ram48-disk50-perf2
- a24-ram48-disk80-perf1
- a24-ram48-disk80-perf2
- nvl4-a24-ram48-disk0
- nvl4-a24-ram48-disk50-perf1
- nvl4-a24-ram48-disk50-perf2
- nvl4-a24-ram48-disk80-perf1
- nvl4-a24-ram48-disk80-perf2
- a24-ram96-disk0
- a24-ram96-disk20-perf1
- a24-ram96-disk20-perf2
- a24-ram96-disk50-perf1
- a24-ram96-disk50-perf2
- a24-ram96-disk80-perf1
- a24-ram96-disk80-perf2
- a32-ram64-disk0
- a32-ram64-disk20-perf1
- a32-ram64-disk20-perf2
- a32-ram64-disk50-perf1
- a32-ram64-disk50-perf2
- a32-ram64-disk80-perf1
- a32-ram64-disk80-perf2
- nvl4-a32-ram64-disk0
- nvl4-a32-ram64-disk50-perf1
- nvl4-a32-ram64-disk50-perf2
- nvl4-a32-ram64-disk80-perf1
- nvl4-a32-ram64-disk80-perf2
- a32-ram128-disk0
- a32-ram128-disk20-perf1
- a32-ram128-disk20-perf2
- a32-ram128-disk50-perf1
- a32-ram128-disk50-perf2
- a32-ram128-disk80-perf1
- a32-ram128-disk80-perf2
- a48-ram96-disk0
- a48-ram96-disk20-perf1
- a48-ram96-disk20-perf2
- a48-ram96-disk50-perf1
- a48-ram96-disk50-perf2
- a48-ram96-disk80-perf1
- a48-ram96-disk80-perf2
- nvl4-a48-ram96-disk0
- nvl4-a48-ram96-disk50-perf1
- nvl4-a48-ram96-disk50-perf2
- nvl4-a48-ram96-disk80-perf1
- nvl4-a48-ram96-disk80-perf2
- a48-ram192-disk0
- a48-ram192-disk20-perf1
- a48-ram192-disk20-perf2
- a48-ram192-disk50-perf1
- a48-ram192-disk50-perf2
- a48-ram192-disk80-perf1
- a48-ram192-disk80-perf2
- a64-ram128-disk0
- a64-ram128-disk20-perf1
- a64-ram128-disk20-perf2
- a64-ram128-disk50-perf1
- a64-ram128-disk50-perf2
- a64-ram128-disk80-perf1
- a64-ram128-disk80-perf2
- nvl4-a64-ram128-disk0
- nvl4-a64-ram128-disk50-perf1
- nvl4-a64-ram128-disk50-perf2
- nvl4-a64-ram128-disk80-perf1
- nvl4-a64-ram128-disk80-perf2
- a64-ram256-disk0
- a64-ram256-disk20-perf1
- a64-ram256-disk20-perf2
- a64-ram256-disk50-perf1
- a64-ram256-disk50-perf2
- a64-ram256-disk80-perf1
- a64-ram256-disk80-perf2