a4-ram8-disk80-perf1 by infomaniak
Geekbench is a cross-platform processor benchmark with a scoring system that determines single-core and multi-core performance using loads simulating real-world scenarios. Geekbench 5 score is calculated with a reference score of 2500 representing the performance of the Intel Core i5-2520M @ 2.50 GHz. The software benchmark is available for Mac OS, Windows, Linux, Android and iOS platforms.
Specifications:
CPU
4
RAM
8.0 GB
Root
80 GB
Root disk
{
"configuration": {
"chart": {
"type": "scatter",
"polar": false,
"zoomType": "",
"options3d": {},
"height": null,
"width": null,
"margin": null,
"inverted": false,
"zooming": {}
},
"credits": {
"enabled": false
},
"title": {
"text": ""
},
"colorAxis": null,
"subtitle": {
"text": ""
},
"xAxis": {
"title": {
"text": [
"Single Score"
],
"useHTML": false,
"style": {
"color": "#666666"
}
},
"categories": null,
"lineWidth": 1,
"tickInterval": null,
"tickWidth": 1,
"tickLength": 10,
"tickPixelInterval": 100,
"plotLines": null,
"labels": {
"enabled": true,
"format": null,
"formatter": "",
"style": {
"color": "#666666",
"cursor": "default",
"fontSize": "11px"
},
"useHTML": false,
"step": 0
},
"plotBands": null,
"visible": true,
"floor": null,
"ceiling": null,
"type": "linear",
"min": 0,
"gridLineWidth": 1,
"gridLineColor": "#e6e6e6",
"minorTickInterval": null,
"minorTickWidth": 0,
"minTickInterval": null,
"startOnTick": true,
"endOnTick": true,
"tickmarkPlacement": 100,
"units": 100,
"minRange": 100
},
"yAxis": {
"title": {
"text": [
"Multi Score"
],
"useHTML": false,
"style": {
"color": "#666666"
}
},
"categories": null,
"plotLines": null,
"plotBands": null,
"lineWidth": null,
"tickInterval": null,
"tickLength": 10,
"floor": null,
"ceiling": null,
"gridLineInterpolation": null,
"gridLineWidth": 1,
"gridLineColor": "#e6e6e6",
"min": 0,
"max": null,
"minorTickInterval": null,
"minorTickWidth": 0,
"minTickInterval": null,
"startOnTick": true,
"endOnTick": true,
"minRange": null,
"type": "linear",
"tickmarkPlacement": null,
"labels": {
"enabled": true,
"formatter": null,
"style": {
"color": "#666666",
"cursor": "default",
"fontSize": "11px"
},
"useHTML": false
}
},
"zAxis": {
"title": {
"text": "Multi Score"
}
},
"plotOptions": {
"series": {
"dataLabels": {
"enabled": false,
"format": null,
"distance": 30,
"align": "center",
"inside": null,
"allowOverlap": false,
"style": {
"fontSize": "11px"
}
},
"showInLegend": null,
"turboThreshold": 0,
"stacking": "",
"groupPadding": 0.2,
"centerInCategory": false,
"findNearestPointBy": "x"
}
},
"navigator": {
"enabled": false
},
"scrollbar": {
"enabled": false
},
"rangeSelector": {
"enabled": false,
"inputEnabled": false
},
"legend": {
"enabled": null,
"maxHeight": null,
"align": "center",
"verticalAlign": "bottom",
"layout": "horizontal",
"width": null,
"margin": 12,
"reversed": false
},
"series": [
{
"name": "a4-ram8-disk80-perf1 by infomaniak",
"color": "#0098FF",
"data": [
{
"x": 1009.8388268831175,
"y": 3517.514564490215
},
{
"x": 966.7145735590941,
"y": 3623.691860809598
},
{
"x": 972.7357821826548,
"y": 3692.6640739999157
},
{
"x": 969.0489154113257,
"y": 3621.51107207551
},
{
"x": 1004.2164051216955,
"y": 3691.3654974789256
},
{
"x": 977.5411110750863,
"y": 3703.342068994374
},
{
"x": 1016.6321355991399,
"y": 3678.2388591820572
},
{
"x": 976.0921941336157,
"y": 3608.6482961077368
},
{
"x": 974.0437262101085,
"y": 3745.815778324104
},
{
"x": 986.5763265568526,
"y": 3707.3165896065234
},
{
"x": 1002.4807466447448,
"y": 3700.633673407955
},
{
"x": 974.8334416551606,
"y": 3741.868556135799
},
{
"x": 1005.4010123038832,
"y": 3706.2319289921998
},
{
"x": 1007.2473740280401,
"y": 3687.2375921329512
},
{
"x": 997.0084507855852,
"y": 3696.403804078848
},
{
"x": 1004.3366042458342,
"y": 3707.629340625929
},
{
"x": 1002.1211416892246,
"y": 3692.6991906595667
},
{
"x": 999.7537777236804,
"y": 3728.575103840658
},
{
"x": 1002.9905735645445,
"y": 3686.267294132542
},
{
"x": 1003.3960679673148,
"y": 3722.3229537723846
}
]
}
],
"drilldown": {},
"tooltip": {
"enabled": true,
"useHTML": false,
"format": null,
"headerFormat": "",
"pointFormat": "<span style=\"color:{series.color}\">Single</span>: <b>{point.x:.0f}</b><br><span style=\"color:{series.color}\">Multi</span>: <b>{point.y:.0f}</b>",
"footerFormat": "",
"shared": false,
"outside": false,
"valueDecimals": null,
"split": false
},
"annotations": null
},
"hc_type": "chart",
"id": "107873704816892629707898373811372906156"
}
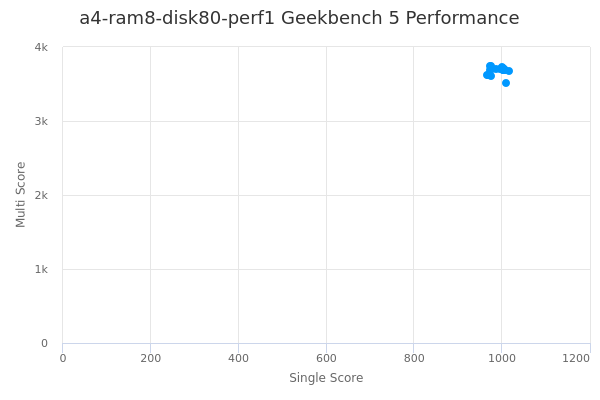
| Single | Multi | |
|---|---|---|
| Max | 1017 | 3746 |
| Average | 993 | 3683 |
| Deviation | 15.53 | 52.06 |
| Min | 967 | 3518 |
Sign up as Freemium to get more insight.
- In same series
- a1-ram2-disk0
- a1-ram2-disk20-perf1
- a1-ram2-disk50-perf1
- a1-ram2-disk80-perf1
- a2-ram4-disk0
- a2-ram4-disk20-perf1
- a2-ram4-disk50-perf1
- a2-ram4-disk80-perf1
- a4-ram8-disk0
- a4-ram8-disk20-perf1
- a4-ram8-disk20-perf2
- a4-ram8-disk50-perf1
- a4-ram8-disk50-perf2
- a4-ram8-disk80-perf1
- a4-ram8-disk80-perf2
- nvl4-a4-ram8-disk0
- nvl4-a4-ram8-disk50-perf1
- nvl4-a4-ram8-disk50-perf2
- nvl4-a4-ram8-disk80-perf1
- nvl4-a4-ram8-disk80-perf2
- a4-ram16-disk0
- a4-ram16-disk20-perf1
- a4-ram16-disk20-perf2
- a4-ram16-disk50-perf1
- a4-ram16-disk50-perf2
- a4-ram16-disk80-perf1
- a4-ram16-disk80-perf2
- a8-ram16-disk0
- a8-ram16-disk20-perf1
- a8-ram16-disk20-perf2
- a8-ram16-disk50-perf1
- a8-ram16-disk50-perf2
- a8-ram16-disk80-perf1
- a8-ram16-disk80-perf2
- nvl4-a8-ram16-disk0
- nvl4-a8-ram16-disk50-perf1
- nvl4-a8-ram16-disk50-perf2
- nvl4-a8-ram16-disk80-perf1
- nvl4-a8-ram16-disk80-perf2
- a8-ram32-disk0
- a8-ram32-disk20-perf1
- a8-ram32-disk20-perf2
- a8-ram32-disk50-perf1
- a8-ram32-disk50-perf2
- a8-ram32-disk80-perf1
- a8-ram32-disk80-perf2
- a12-ram24-disk0
- a12-ram24-disk20-perf1
- a12-ram24-disk20-perf2
- a12-ram24-disk50-perf1
- a12-ram24-disk50-perf2
- a12-ram24-disk80-perf1
- a12-ram24-disk80-perf2
- nvl4-a12-ram24-disk0
- nvl4-a12-ram24-disk50-perf1
- nvl4-a12-ram24-disk50-perf2
- nvl4-a12-ram24-disk80-perf1
- nvl4-a12-ram24-disk80-perf2
- a12-ram48-disk0
- a12-ram48-disk20-perf1
- a12-ram48-disk20-perf2
- a12-ram48-disk50-perf1
- a12-ram48-disk50-perf2
- a12-ram48-disk80-perf1
- a12-ram48-disk80-perf2
- a16-ram32-disk0
- a16-ram32-disk20-perf1
- a16-ram32-disk20-perf2
- a16-ram32-disk50-perf1
- a16-ram32-disk50-perf2
- a16-ram32-disk80-perf1
- a16-ram32-disk80-perf2
- nvl4-a16-ram32-disk0
- nvl4-a16-ram32-disk50-perf1
- nvl4-a16-ram32-disk50-perf2
- nvl4-a16-ram32-disk80-perf1
- nvl4-a16-ram32-disk80-perf2
- a16-ram64-disk0
- a16-ram64-disk20-perf1
- a16-ram64-disk20-perf2
- a16-ram64-disk50-perf1
- a16-ram64-disk50-perf2
- a16-ram64-disk80-perf1
- a16-ram64-disk80-perf2
- a24-ram48-disk0
- a24-ram48-disk20-perf1
- a24-ram48-disk20-perf2
- a24-ram48-disk50-perf1
- a24-ram48-disk50-perf2
- a24-ram48-disk80-perf1
- a24-ram48-disk80-perf2
- nvl4-a24-ram48-disk0
- nvl4-a24-ram48-disk50-perf1
- nvl4-a24-ram48-disk50-perf2
- nvl4-a24-ram48-disk80-perf1
- nvl4-a24-ram48-disk80-perf2
- a24-ram96-disk0
- a24-ram96-disk20-perf1
- a24-ram96-disk20-perf2
- a24-ram96-disk50-perf1
- a24-ram96-disk50-perf2
- a24-ram96-disk80-perf1
- a24-ram96-disk80-perf2
- a32-ram64-disk0
- a32-ram64-disk20-perf1
- a32-ram64-disk20-perf2
- a32-ram64-disk50-perf1
- a32-ram64-disk50-perf2
- a32-ram64-disk80-perf1
- a32-ram64-disk80-perf2
- nvl4-a32-ram64-disk0
- nvl4-a32-ram64-disk50-perf1
- nvl4-a32-ram64-disk50-perf2
- nvl4-a32-ram64-disk80-perf1
- nvl4-a32-ram64-disk80-perf2
- a32-ram128-disk0
- a32-ram128-disk20-perf1
- a32-ram128-disk20-perf2
- a32-ram128-disk50-perf1
- a32-ram128-disk50-perf2
- a32-ram128-disk80-perf1
- a32-ram128-disk80-perf2
- a48-ram96-disk0
- a48-ram96-disk20-perf1
- a48-ram96-disk20-perf2
- a48-ram96-disk50-perf1
- a48-ram96-disk50-perf2
- a48-ram96-disk80-perf1
- a48-ram96-disk80-perf2
- nvl4-a48-ram96-disk0
- nvl4-a48-ram96-disk50-perf1
- nvl4-a48-ram96-disk50-perf2
- nvl4-a48-ram96-disk80-perf1
- nvl4-a48-ram96-disk80-perf2
- a48-ram192-disk0
- a48-ram192-disk20-perf1
- a48-ram192-disk20-perf2
- a48-ram192-disk50-perf1
- a48-ram192-disk50-perf2
- a48-ram192-disk80-perf1
- a48-ram192-disk80-perf2
- a64-ram128-disk0
- a64-ram128-disk20-perf1
- a64-ram128-disk20-perf2
- a64-ram128-disk50-perf1
- a64-ram128-disk50-perf2
- a64-ram128-disk80-perf1
- a64-ram128-disk80-perf2
- nvl4-a64-ram128-disk0
- nvl4-a64-ram128-disk50-perf1
- nvl4-a64-ram128-disk50-perf2
- nvl4-a64-ram128-disk80-perf1
- nvl4-a64-ram128-disk80-perf2
- a64-ram256-disk0
- a64-ram256-disk20-perf1
- a64-ram256-disk20-perf2
- a64-ram256-disk50-perf1
- a64-ram256-disk50-perf2
- a64-ram256-disk80-perf1
- a64-ram256-disk80-perf2