a1-ram2-disk50-perf1 by infomaniak
Geekbench is a cross-platform processor benchmark with a scoring system that determines single-core and multi-core performance using loads simulating real-world scenarios. Geekbench 5 score is calculated with a reference score of 2500 representing the performance of the Intel Core i5-2520M @ 2.50 GHz. The software benchmark is available for Mac OS, Windows, Linux, Android and iOS platforms.
Specifications:
CPU
1
RAM
2.0 GB
Root
50 GB
Root disk
{
"configuration": {
"chart": {
"type": "scatter",
"polar": false,
"zoomType": "",
"options3d": {},
"height": null,
"width": null,
"margin": null,
"inverted": false,
"zooming": {}
},
"credits": {
"enabled": false
},
"title": {
"text": ""
},
"colorAxis": null,
"subtitle": {
"text": ""
},
"xAxis": {
"title": {
"text": [
"Single Score"
],
"useHTML": false,
"style": {
"color": "#666666"
}
},
"categories": null,
"lineWidth": 1,
"tickInterval": null,
"tickWidth": 1,
"tickLength": 10,
"tickPixelInterval": 100,
"plotLines": null,
"labels": {
"enabled": true,
"format": null,
"formatter": "",
"style": {
"color": "#666666",
"cursor": "default",
"fontSize": "11px"
},
"useHTML": false,
"step": 0
},
"plotBands": null,
"visible": true,
"floor": null,
"ceiling": null,
"type": "linear",
"min": 0,
"gridLineWidth": 1,
"gridLineColor": "#e6e6e6",
"minorTickInterval": null,
"minorTickWidth": 0,
"minTickInterval": null,
"startOnTick": true,
"endOnTick": true,
"tickmarkPlacement": 100,
"units": 100,
"minRange": 100
},
"yAxis": {
"title": {
"text": [
"Multi Score"
],
"useHTML": false,
"style": {
"color": "#666666"
}
},
"categories": null,
"plotLines": null,
"plotBands": null,
"lineWidth": null,
"tickInterval": null,
"tickLength": 10,
"floor": null,
"ceiling": null,
"gridLineInterpolation": null,
"gridLineWidth": 1,
"gridLineColor": "#e6e6e6",
"min": 0,
"max": null,
"minorTickInterval": null,
"minorTickWidth": 0,
"minTickInterval": null,
"startOnTick": true,
"endOnTick": true,
"minRange": null,
"type": "linear",
"tickmarkPlacement": null,
"labels": {
"enabled": true,
"formatter": null,
"style": {
"color": "#666666",
"cursor": "default",
"fontSize": "11px"
},
"useHTML": false
}
},
"zAxis": {
"title": {
"text": "Multi Score"
}
},
"plotOptions": {
"series": {
"dataLabels": {
"enabled": false,
"format": null,
"distance": 30,
"align": "center",
"inside": null,
"allowOverlap": false,
"style": {
"fontSize": "11px"
}
},
"showInLegend": null,
"turboThreshold": 0,
"stacking": "",
"groupPadding": 0.2,
"centerInCategory": false,
"findNearestPointBy": "x"
}
},
"navigator": {
"enabled": false
},
"scrollbar": {
"enabled": false
},
"rangeSelector": {
"enabled": false,
"inputEnabled": false
},
"legend": {
"enabled": null,
"maxHeight": null,
"align": "center",
"verticalAlign": "bottom",
"layout": "horizontal",
"width": null,
"margin": 12,
"reversed": false
},
"series": [
{
"name": "a1-ram2-disk50-perf1 by infomaniak",
"color": "#0098FF",
"data": [
{
"x": 1034.2306128504,
"y": 1026.7190231665377
},
{
"x": 991.673431274839,
"y": 993.9327666499659
},
{
"x": 1046.5897252280765,
"y": 1044.0548628378965
},
{
"x": 1006.1250926728121,
"y": 1006.308274247684
},
{
"x": 1043.274594538343,
"y": 1037.7229092598395
},
{
"x": 1005.5977593298446,
"y": 1002.0658863945548
},
{
"x": 1042.9438719007494,
"y": 1041.0008993183465
},
{
"x": 1013.505916576715,
"y": 1000.0182511075548
},
{
"x": 1043.505215038589,
"y": 1040.7831254495518
},
{
"x": 999.3445733313174,
"y": 1013.4621679622514
},
{
"x": 1040.633116831067,
"y": 1028.8903402631083
},
{
"x": 1008.436188032704,
"y": 1011.275599450709
},
{
"x": 1052.3257554390489,
"y": 1021.0403645285917
},
{
"x": 1016.9484502172623,
"y": 1015.5469938189099
},
{
"x": 1040.577999095326,
"y": 1032.8159751889252
},
{
"x": 1018.5920435816759,
"y": 996.7194567340624
},
{
"x": 1041.4696689420641,
"y": 1031.930547237398
},
{
"x": 1014.8061230466446,
"y": 997.4779395862556
},
{
"x": 1045.6432540324301,
"y": 1032.499279928725
},
{
"x": 998.1973724483911,
"y": 982.6380411597754
}
]
}
],
"drilldown": {},
"tooltip": {
"enabled": true,
"useHTML": false,
"format": null,
"headerFormat": "",
"pointFormat": "<span style=\"color:{series.color}\">Single</span>: <b>{point.x:.0f}</b><br><span style=\"color:{series.color}\">Multi</span>: <b>{point.y:.0f}</b>",
"footerFormat": "",
"shared": false,
"outside": false,
"valueDecimals": null,
"split": false
},
"annotations": null
},
"hc_type": "chart",
"id": "75487704668019652352799903091901063973"
}
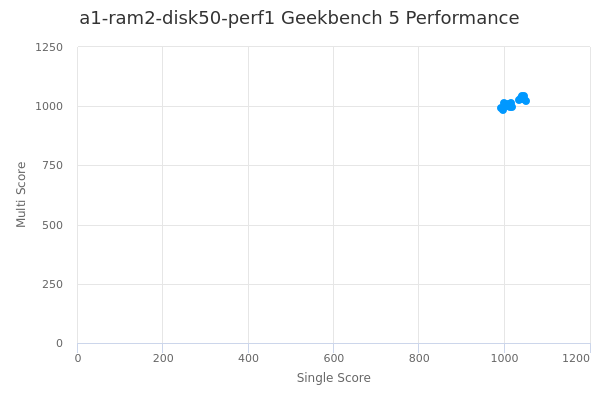
| Single | Multi | |
|---|---|---|
| Max | 1052 | 1044 |
| Average | 1025 | 1018 |
| Deviation | 19.13 | 17.93 |
| Min | 992 | 983 |
Sign up as Freemium to get more insight.
- In same series
- a1-ram2-disk0
- a1-ram2-disk20-perf1
- a1-ram2-disk50-perf1
- a1-ram2-disk80-perf1
- a2-ram4-disk0
- a2-ram4-disk20-perf1
- a2-ram4-disk50-perf1
- a2-ram4-disk80-perf1
- a4-ram8-disk0
- a4-ram8-disk20-perf1
- a4-ram8-disk20-perf2
- a4-ram8-disk50-perf1
- a4-ram8-disk50-perf2
- a4-ram8-disk80-perf1
- a4-ram8-disk80-perf2
- nvl4-a4-ram8-disk0
- nvl4-a4-ram8-disk50-perf1
- nvl4-a4-ram8-disk50-perf2
- nvl4-a4-ram8-disk80-perf1
- nvl4-a4-ram8-disk80-perf2
- a4-ram16-disk0
- a4-ram16-disk20-perf1
- a4-ram16-disk20-perf2
- a4-ram16-disk50-perf1
- a4-ram16-disk50-perf2
- a4-ram16-disk80-perf1
- a4-ram16-disk80-perf2
- a8-ram16-disk0
- a8-ram16-disk20-perf1
- a8-ram16-disk20-perf2
- a8-ram16-disk50-perf1
- a8-ram16-disk50-perf2
- a8-ram16-disk80-perf1
- a8-ram16-disk80-perf2
- nvl4-a8-ram16-disk0
- nvl4-a8-ram16-disk50-perf1
- nvl4-a8-ram16-disk50-perf2
- nvl4-a8-ram16-disk80-perf1
- nvl4-a8-ram16-disk80-perf2
- a8-ram32-disk0
- a8-ram32-disk20-perf1
- a8-ram32-disk20-perf2
- a8-ram32-disk50-perf1
- a8-ram32-disk50-perf2
- a8-ram32-disk80-perf1
- a8-ram32-disk80-perf2
- a12-ram24-disk0
- a12-ram24-disk20-perf1
- a12-ram24-disk20-perf2
- a12-ram24-disk50-perf1
- a12-ram24-disk50-perf2
- a12-ram24-disk80-perf1
- a12-ram24-disk80-perf2
- nvl4-a12-ram24-disk0
- nvl4-a12-ram24-disk50-perf1
- nvl4-a12-ram24-disk50-perf2
- nvl4-a12-ram24-disk80-perf1
- nvl4-a12-ram24-disk80-perf2
- a12-ram48-disk0
- a12-ram48-disk20-perf1
- a12-ram48-disk20-perf2
- a12-ram48-disk50-perf1
- a12-ram48-disk50-perf2
- a12-ram48-disk80-perf1
- a12-ram48-disk80-perf2
- a16-ram32-disk0
- a16-ram32-disk20-perf1
- a16-ram32-disk20-perf2
- a16-ram32-disk50-perf1
- a16-ram32-disk50-perf2
- a16-ram32-disk80-perf1
- a16-ram32-disk80-perf2
- nvl4-a16-ram32-disk0
- nvl4-a16-ram32-disk50-perf1
- nvl4-a16-ram32-disk50-perf2
- nvl4-a16-ram32-disk80-perf1
- nvl4-a16-ram32-disk80-perf2
- a16-ram64-disk0
- a16-ram64-disk20-perf1
- a16-ram64-disk20-perf2
- a16-ram64-disk50-perf1
- a16-ram64-disk50-perf2
- a16-ram64-disk80-perf1
- a16-ram64-disk80-perf2
- a24-ram48-disk0
- a24-ram48-disk20-perf1
- a24-ram48-disk20-perf2
- a24-ram48-disk50-perf1
- a24-ram48-disk50-perf2
- a24-ram48-disk80-perf1
- a24-ram48-disk80-perf2
- nvl4-a24-ram48-disk0
- nvl4-a24-ram48-disk50-perf1
- nvl4-a24-ram48-disk50-perf2
- nvl4-a24-ram48-disk80-perf1
- nvl4-a24-ram48-disk80-perf2
- a24-ram96-disk0
- a24-ram96-disk20-perf1
- a24-ram96-disk20-perf2
- a24-ram96-disk50-perf1
- a24-ram96-disk50-perf2
- a24-ram96-disk80-perf1
- a24-ram96-disk80-perf2
- a32-ram64-disk0
- a32-ram64-disk20-perf1
- a32-ram64-disk20-perf2
- a32-ram64-disk50-perf1
- a32-ram64-disk50-perf2
- a32-ram64-disk80-perf1
- a32-ram64-disk80-perf2
- nvl4-a32-ram64-disk0
- nvl4-a32-ram64-disk50-perf1
- nvl4-a32-ram64-disk50-perf2
- nvl4-a32-ram64-disk80-perf1
- nvl4-a32-ram64-disk80-perf2
- a32-ram128-disk0
- a32-ram128-disk20-perf1
- a32-ram128-disk20-perf2
- a32-ram128-disk50-perf1
- a32-ram128-disk50-perf2
- a32-ram128-disk80-perf1
- a32-ram128-disk80-perf2
- a48-ram96-disk0
- a48-ram96-disk20-perf1
- a48-ram96-disk20-perf2
- a48-ram96-disk50-perf1
- a48-ram96-disk50-perf2
- a48-ram96-disk80-perf1
- a48-ram96-disk80-perf2
- nvl4-a48-ram96-disk0
- nvl4-a48-ram96-disk50-perf1
- nvl4-a48-ram96-disk50-perf2
- nvl4-a48-ram96-disk80-perf1
- nvl4-a48-ram96-disk80-perf2
- a48-ram192-disk0
- a48-ram192-disk20-perf1
- a48-ram192-disk20-perf2
- a48-ram192-disk50-perf1
- a48-ram192-disk50-perf2
- a48-ram192-disk80-perf1
- a48-ram192-disk80-perf2
- a64-ram128-disk0
- a64-ram128-disk20-perf1
- a64-ram128-disk20-perf2
- a64-ram128-disk50-perf1
- a64-ram128-disk50-perf2
- a64-ram128-disk80-perf1
- a64-ram128-disk80-perf2
- nvl4-a64-ram128-disk0
- nvl4-a64-ram128-disk50-perf1
- nvl4-a64-ram128-disk50-perf2
- nvl4-a64-ram128-disk80-perf1
- nvl4-a64-ram128-disk80-perf2
- a64-ram256-disk0
- a64-ram256-disk20-perf1
- a64-ram256-disk20-perf2
- a64-ram256-disk50-perf1
- a64-ram256-disk50-perf2
- a64-ram256-disk80-perf1
- a64-ram256-disk80-perf2