b1.64 by hopla.cloud
Geekbench is a cross-platform processor benchmark with a scoring system that determines single-core and multi-core performance using loads simulating real-world scenarios. Geekbench 5 score is calculated with a reference score of 2500 representing the performance of the Intel Core i5-2520M @ 2.50 GHz. The software benchmark is available for Mac OS, Windows, Linux, Android and iOS platforms.
Specifications:
CPU
16
RAM
64.0 GB
Root
240 GB
b1.64 Root SSD
{
"configuration": {
"chart": {
"type": "scatter",
"polar": false,
"zoomType": "",
"options3d": {},
"height": null,
"width": null,
"margin": null,
"inverted": false,
"zooming": {}
},
"credits": {
"enabled": false
},
"title": {
"text": ""
},
"colorAxis": null,
"subtitle": {
"text": ""
},
"xAxis": {
"title": {
"text": [
"Single Score"
],
"useHTML": false,
"style": {
"color": "#666666"
}
},
"categories": null,
"lineWidth": 1,
"tickInterval": null,
"tickWidth": 1,
"tickLength": 10,
"tickPixelInterval": 100,
"plotLines": null,
"labels": {
"enabled": true,
"format": null,
"formatter": "",
"style": {
"color": "#666666",
"cursor": "default",
"fontSize": "11px"
},
"useHTML": false,
"step": 0
},
"plotBands": null,
"visible": true,
"floor": null,
"ceiling": null,
"type": "linear",
"min": 0,
"gridLineWidth": 1,
"gridLineColor": "#e6e6e6",
"minorTickInterval": null,
"minorTickWidth": 0,
"minTickInterval": null,
"startOnTick": true,
"endOnTick": true,
"tickmarkPlacement": 100,
"units": 100,
"minRange": 100
},
"yAxis": {
"title": {
"text": [
"Multi Score"
],
"useHTML": false,
"style": {
"color": "#666666"
}
},
"categories": null,
"plotLines": null,
"plotBands": null,
"lineWidth": null,
"tickInterval": null,
"tickLength": 10,
"floor": null,
"ceiling": null,
"gridLineInterpolation": null,
"gridLineWidth": 1,
"gridLineColor": "#e6e6e6",
"min": 0,
"max": null,
"minorTickInterval": null,
"minorTickWidth": 0,
"minTickInterval": null,
"startOnTick": true,
"endOnTick": true,
"minRange": null,
"type": "linear",
"tickmarkPlacement": null,
"labels": {
"enabled": true,
"formatter": null,
"style": {
"color": "#666666",
"cursor": "default",
"fontSize": "11px"
},
"useHTML": false
}
},
"zAxis": {
"title": {
"text": "Multi Score"
}
},
"plotOptions": {
"series": {
"dataLabels": {
"enabled": false,
"format": null,
"distance": 30,
"align": "center",
"inside": null,
"allowOverlap": false,
"style": {
"fontSize": "11px"
}
},
"showInLegend": null,
"turboThreshold": 0,
"stacking": "",
"groupPadding": 0.2,
"centerInCategory": false,
"findNearestPointBy": "x"
}
},
"navigator": {
"enabled": false
},
"scrollbar": {
"enabled": false
},
"rangeSelector": {
"enabled": false,
"inputEnabled": false
},
"legend": {
"enabled": null,
"maxHeight": null,
"align": "center",
"verticalAlign": "bottom",
"layout": "horizontal",
"width": null,
"margin": 12,
"reversed": false
},
"series": [
{
"name": "b1.64 by hopla.cloud",
"color": "#0bded6",
"data": [
{
"x": 772.0778720556129,
"y": 9690.426796680425
},
{
"x": 729.003824508359,
"y": 8124.114203265866
},
{
"x": 776.8408145484719,
"y": 9646.593719563278
},
{
"x": 709.2175315163174,
"y": 8589.874384306539
},
{
"x": 783.6592494860105,
"y": 8944.269045587444
},
{
"x": 709.5384143900051,
"y": 8326.760045167513
},
{
"x": 778.0984553616288,
"y": 8796.480953318447
},
{
"x": 712.7845078799959,
"y": 8596.164209444352
},
{
"x": 783.2587156153496,
"y": 8809.348578850258
},
{
"x": 712.909211491458,
"y": 8397.223457032871
},
{
"x": 779.9296517419247,
"y": 9183.744760005238
},
{
"x": 711.4693935835991,
"y": 8388.759862401948
},
{
"x": 776.5526601066815,
"y": 8840.962321640189
},
{
"x": 709.287502474231,
"y": 8454.076226421523
},
{
"x": 767.6871028221879,
"y": 9203.337892891052
},
{
"x": 712.9961935441355,
"y": 8213.231078887931
},
{
"x": 775.4405949626697,
"y": 8927.655843516584
},
{
"x": 715.1394129184297,
"y": 8660.088533722454
},
{
"x": 773.0669437072661,
"y": 9148.147138421513
},
{
"x": 707.9763298217562,
"y": 8764.901189828868
}
]
}
],
"drilldown": {},
"tooltip": {
"enabled": true,
"useHTML": false,
"format": null,
"headerFormat": "",
"pointFormat": "<span style=\"color:{series.color}\">Single</span>: <b>{point.x:.0f}</b><br><span style=\"color:{series.color}\">Multi</span>: <b>{point.y:.0f}</b>",
"footerFormat": "",
"shared": false,
"outside": false,
"valueDecimals": null,
"split": false
},
"annotations": null
},
"hc_type": "chart",
"id": "283778521861903705725337726063577551776"
}
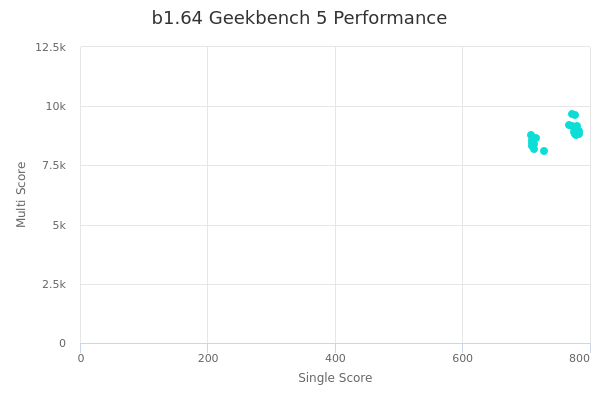
| Single | Multi | |
|---|---|---|
| Max | 784 | 9690 |
| Average | 745 | 8785 |
| Deviation | 32.24 | 421.78 |
| Min | 708 | 8124 |