b1.1 by hopla.cloud
Geekbench is a cross-platform processor benchmark with a scoring system that determines single-core and multi-core performance using loads simulating real-world scenarios. Geekbench 5 score is calculated with a reference score of 2500 representing the performance of the Intel Core i5-2520M @ 2.50 GHz. The software benchmark is available for Mac OS, Windows, Linux, Android and iOS platforms.
Specifications:
CPU
1
RAM
1.0 GB
Root
30 GB
b1.1 Root SSD
{
"configuration": {
"chart": {
"type": "scatter",
"polar": false,
"zoomType": "",
"options3d": {},
"height": null,
"width": null,
"margin": null,
"inverted": false,
"zooming": {}
},
"credits": {
"enabled": false
},
"title": {
"text": ""
},
"colorAxis": null,
"subtitle": {
"text": ""
},
"xAxis": {
"title": {
"text": [
"Single Score"
],
"useHTML": false,
"style": {
"color": "#666666"
}
},
"categories": null,
"lineWidth": 1,
"tickInterval": null,
"tickWidth": 1,
"tickLength": 10,
"tickPixelInterval": 100,
"plotLines": null,
"labels": {
"enabled": true,
"format": null,
"formatter": "",
"style": {
"color": "#666666",
"cursor": "default",
"fontSize": "11px"
},
"useHTML": false,
"step": 0
},
"plotBands": null,
"visible": true,
"floor": null,
"ceiling": null,
"type": "linear",
"min": 0,
"gridLineWidth": 1,
"gridLineColor": "#e6e6e6",
"minorTickInterval": null,
"minorTickWidth": 0,
"minTickInterval": null,
"startOnTick": true,
"endOnTick": true,
"tickmarkPlacement": 100,
"units": 100,
"minRange": 100
},
"yAxis": {
"title": {
"text": [
"Multi Score"
],
"useHTML": false,
"style": {
"color": "#666666"
}
},
"categories": null,
"plotLines": null,
"plotBands": null,
"lineWidth": null,
"tickInterval": null,
"tickLength": 10,
"floor": null,
"ceiling": null,
"gridLineInterpolation": null,
"gridLineWidth": 1,
"gridLineColor": "#e6e6e6",
"min": 0,
"max": null,
"minorTickInterval": null,
"minorTickWidth": 0,
"minTickInterval": null,
"startOnTick": true,
"endOnTick": true,
"minRange": null,
"type": "linear",
"tickmarkPlacement": null,
"labels": {
"enabled": true,
"formatter": null,
"style": {
"color": "#666666",
"cursor": "default",
"fontSize": "11px"
},
"useHTML": false
}
},
"zAxis": {
"title": {
"text": "Multi Score"
}
},
"plotOptions": {
"series": {
"dataLabels": {
"enabled": false,
"format": null,
"distance": 30,
"align": "center",
"inside": null,
"allowOverlap": false,
"style": {
"fontSize": "11px"
}
},
"showInLegend": null,
"turboThreshold": 0,
"stacking": "",
"groupPadding": 0.2,
"centerInCategory": false,
"findNearestPointBy": "x"
}
},
"navigator": {
"enabled": false
},
"scrollbar": {
"enabled": false
},
"rangeSelector": {
"enabled": false,
"inputEnabled": false
},
"legend": {
"enabled": null,
"maxHeight": null,
"align": "center",
"verticalAlign": "bottom",
"layout": "horizontal",
"width": null,
"margin": 12,
"reversed": false
},
"series": [
{
"name": "b1.1 by hopla.cloud",
"color": "#0bded6",
"data": [
{
"x": 677.9140969621632,
"y": 689.6393858899468
},
{
"x": 312.2406137097151,
"y": 315.9304724235427
},
{
"x": 682.0620679712658,
"y": 685.7056873076567
},
{
"x": 683.7348728940382,
"y": 650.2685575467503
},
{
"x": 321.6934107289745,
"y": 312.4282822953649
},
{
"x": 679.7423561992241,
"y": 658.3141306553982
},
{
"x": 683.4632242787621,
"y": 676.5216315023356
},
{
"x": 387.31707800131176,
"y": 655.4954511618082
},
{
"x": 668.6276613697913,
"y": 661.375652621743
},
{
"x": 671.2689888330998,
"y": 659.6216675909786
},
{
"x": 672.0932710315869,
"y": 678.5685502430443
},
{
"x": 668.8364123855883,
"y": 681.9154748272537
},
{
"x": 683.4201740669704,
"y": 681.7358354627763
},
{
"x": 681.2058391875302,
"y": 683.3844940071235
},
{
"x": 688.8138765002298,
"y": 691.0188497909763
},
{
"x": 687.58723421122,
"y": 689.4208867872808
},
{
"x": 696.5445491328519,
"y": 687.1030793375671
},
{
"x": 679.8083053545636,
"y": 667.7623042677717
},
{
"x": 690.7271822575167,
"y": 690.7795477739742
},
{
"x": 694.4908571446649,
"y": 694.1009258018555
}
]
}
],
"drilldown": {},
"tooltip": {
"enabled": true,
"useHTML": false,
"format": null,
"headerFormat": "",
"pointFormat": "<span style=\"color:{series.color}\">Single</span>: <b>{point.x:.0f}</b><br><span style=\"color:{series.color}\">Multi</span>: <b>{point.y:.0f}</b>",
"footerFormat": "",
"shared": false,
"outside": false,
"valueDecimals": null,
"split": false
},
"annotations": null
},
"hc_type": "chart",
"id": "11831929430474365773072316974598966918"
}
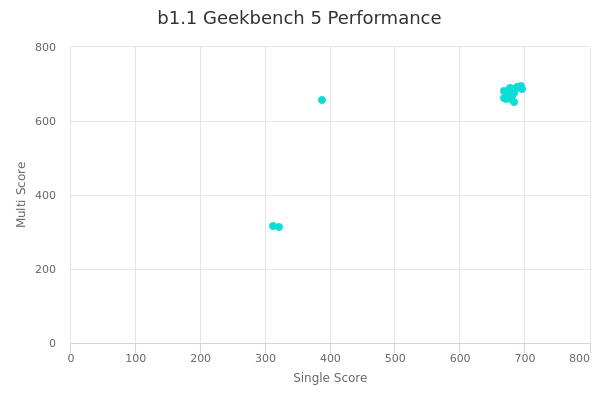
| Single | Multi | |
|---|---|---|
| Max | 697 | 694 |
| Average | 631 | 641 |
| Deviation | 122.80 | 109.58 |
| Min | 312 | 312 |