Custom N1 8 vCPU 16GB Intel Broadwell by Google Cloud
Geekbench is a cross-platform processor benchmark with a scoring system that determines single-core and multi-core performance using loads simulating real-world scenarios. Geekbench 5 score is calculated with a reference score of 2500 representing the performance of the Intel Core i5-2520M @ 2.50 GHz. The software benchmark is available for Mac OS, Windows, Linux, Android and iOS platforms.
Specifications:
CPU
8
RAM
16.0 GB
{
"configuration": {
"chart": {
"type": "scatter",
"polar": false,
"zoomType": "",
"options3d": {},
"height": null,
"width": null,
"margin": null,
"inverted": false,
"zooming": {}
},
"credits": {
"enabled": false
},
"title": {
"text": ""
},
"colorAxis": null,
"subtitle": {
"text": ""
},
"xAxis": {
"title": {
"text": [
"Single Score"
],
"useHTML": false,
"style": {
"color": "#666666"
}
},
"categories": null,
"lineWidth": 1,
"tickInterval": null,
"tickWidth": 1,
"tickLength": 10,
"tickPixelInterval": 100,
"plotLines": null,
"labels": {
"enabled": true,
"format": null,
"formatter": "",
"style": {
"color": "#666666",
"cursor": "default",
"fontSize": "11px"
},
"useHTML": false,
"step": 0
},
"plotBands": null,
"visible": true,
"floor": null,
"ceiling": null,
"type": "linear",
"min": 0,
"gridLineWidth": 1,
"gridLineColor": "#e6e6e6",
"minorTickInterval": null,
"minorTickWidth": 0,
"minTickInterval": null,
"startOnTick": true,
"endOnTick": true,
"tickmarkPlacement": 100,
"units": 100,
"minRange": 100
},
"yAxis": {
"title": {
"text": [
"Multi Score"
],
"useHTML": false,
"style": {
"color": "#666666"
}
},
"categories": null,
"plotLines": null,
"plotBands": null,
"lineWidth": null,
"tickInterval": null,
"tickLength": 10,
"floor": null,
"ceiling": null,
"gridLineInterpolation": null,
"gridLineWidth": 1,
"gridLineColor": "#e6e6e6",
"min": 0,
"max": null,
"minorTickInterval": null,
"minorTickWidth": 0,
"minTickInterval": null,
"startOnTick": true,
"endOnTick": true,
"minRange": null,
"type": "linear",
"tickmarkPlacement": null,
"labels": {
"enabled": true,
"formatter": null,
"style": {
"color": "#666666",
"cursor": "default",
"fontSize": "11px"
},
"useHTML": false
}
},
"zAxis": {
"title": {
"text": "Multi Score"
}
},
"plotOptions": {
"series": {
"dataLabels": {
"enabled": false,
"format": null,
"distance": 30,
"align": "center",
"inside": null,
"allowOverlap": false,
"style": {
"fontSize": "11px"
}
},
"showInLegend": null,
"turboThreshold": 0,
"stacking": "",
"groupPadding": 0.2,
"centerInCategory": false,
"findNearestPointBy": "x"
}
},
"navigator": {
"enabled": false
},
"scrollbar": {
"enabled": false
},
"rangeSelector": {
"enabled": false,
"inputEnabled": false
},
"legend": {
"enabled": null,
"maxHeight": null,
"align": "center",
"verticalAlign": "bottom",
"layout": "horizontal",
"width": null,
"margin": 12,
"reversed": false
},
"series": [
{
"name": "Custom N1 8 vCPU 16GB Intel Broadwell by Google Cloud",
"color": "#55b400",
"data": [
{
"x": 920.5718862722476,
"y": 4296.113973522274
},
{
"x": 903.6303109090684,
"y": 4266.274402674555
},
{
"x": 919.3645896303844,
"y": 4290.205515301635
},
{
"x": 907.8450106342461,
"y": 4264.521699904892
},
{
"x": 920.3057117036739,
"y": 4286.530448089782
},
{
"x": 911.9676017161862,
"y": 4264.442627201552
},
{
"x": 919.3751886487623,
"y": 4294.609243415653
},
{
"x": 906.692874817536,
"y": 4245.96287165785
},
{
"x": 922.3451927162266,
"y": 4296.540067698818
},
{
"x": 907.8181068798037,
"y": 4256.239719149436
},
{
"x": 912.4523078137418,
"y": 4277.428387507128
},
{
"x": 904.9716292832761,
"y": 4261.014013583598
},
{
"x": 914.144263461071,
"y": 4274.500389327655
},
{
"x": 907.4652367116512,
"y": 4247.181146667639
},
{
"x": 915.1018227294929,
"y": 4289.4350172698305
},
{
"x": 905.9630525427282,
"y": 4250.18733582824
},
{
"x": 916.1832982361013,
"y": 4277.385319008436
},
{
"x": 904.9978306477292,
"y": 4252.726693724553
},
{
"x": 918.9716803223816,
"y": 4279.228817478247
},
{
"x": 902.6986280827274,
"y": 4240.847033337978
}
]
}
],
"drilldown": {},
"tooltip": {
"enabled": true,
"useHTML": false,
"format": null,
"headerFormat": "",
"pointFormat": "<span style=\"color:{series.color}\">Single</span>: <b>{point.x:.0f}</b><br><span style=\"color:{series.color}\">Multi</span>: <b>{point.y:.0f}</b>",
"footerFormat": "",
"shared": false,
"outside": false,
"valueDecimals": null,
"split": false
},
"annotations": null
},
"hc_type": "chart",
"id": "157884183337098062954938437376859326006"
}
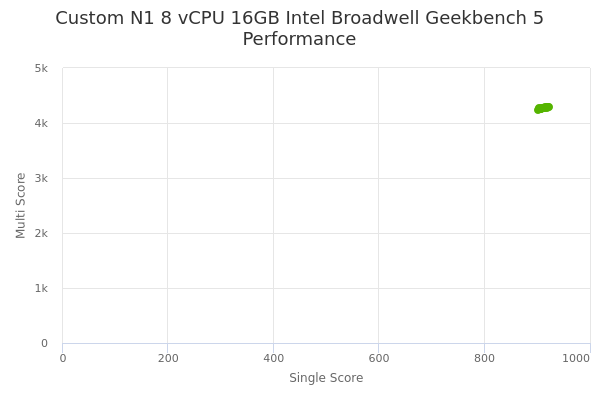
| Single | Multi | |
|---|---|---|
| Max | 922 | 4297 |
| Average | 912 | 4271 |
| Deviation | 6.38 | 17.67 |
| Min | 903 | 4241 |
Sign up as Freemium to get more insight.
- In same series
- Custom N1 1 vCPU 1GB Intel Broadwell
- Custom N1 1 vCPU 2GB Intel Broadwell
- Custom N1 1 vCPU 3GB Intel Broadwell
- Custom N1 1 vCPU 6GB Intel Broadwell
- Custom N1 2 vCPU 3GB Intel Broadwell
- Custom N1 2 vCPU 4GB Intel Broadwell
- Custom N1 2 vCPU 6GB Intel Broadwell
- Custom N1 2 vCPU 12GB Intel Broadwell
- Custom N1 3 vCPU 3GB Intel Broadwell
- Custom N1 3 vCPU 4GB Intel Broadwell
- Custom N1 3 vCPU 6GB Intel Broadwell
- Custom N1 3 vCPU 8GB Intel Broadwell
- Custom N1 3 vCPU 12GB Intel Broadwell
- Custom N1 3 vCPU 16GB Intel Broadwell
- Custom N1 4 vCPU 6GB Intel Broadwell
- Custom N1 4 vCPU 8GB Intel Broadwell
- Custom N1 4 vCPU 12GB Intel Broadwell
- Custom N1 4 vCPU 24GB Intel Broadwell
- Custom N1 6 vCPU 6GB Intel Broadwell
- Custom N1 6 vCPU 8GB Intel Broadwell
- Custom N1 6 vCPU 12GB Intel Broadwell
- Custom N1 6 vCPU 16GB Intel Broadwell
- Custom N1 6 vCPU 24GB Intel Broadwell
- Custom N1 6 vCPU 32GB Intel Broadwell
- Custom N1 8 vCPU 12GB Intel Broadwell
- Custom N1 8 vCPU 16GB Intel Broadwell
- Custom N1 8 vCPU 24GB Intel Broadwell
- Custom N1 8 vCPU 32GB Intel Broadwell
- Custom N1 8 vCPU 48GB Intel Broadwell
- Custom N1 10 vCPU 12GB Intel Broadwell
- Custom N1 10 vCPU 16GB Intel Broadwell
- Custom N1 10 vCPU 24GB Intel Broadwell
- Custom N1 10 vCPU 32GB Intel Broadwell
- Custom N1 10 vCPU 48GB Intel Broadwell
- Custom N1 10 vCPU 64GB Intel Broadwell
- Custom N1 12 vCPU 12GB Intel Broadwell
- Custom N1 12 vCPU 16GB Intel Broadwell
- Custom N1 12 vCPU 24GB Intel Broadwell
- Custom N1 12 vCPU 32GB Intel Broadwell
- Custom N1 12 vCPU 48GB Intel Broadwell
- Custom N1 12 vCPU 64GB Intel Broadwell
- Custom N1 16 vCPU 16GB Intel Broadwell
- Custom N1 16 vCPU 24GB Intel Broadwell
- Custom N1 16 vCPU 32GB Intel Broadwell
- Custom N1 16 vCPU 48GB Intel Broadwell
- Custom N1 16 vCPU 64GB Intel Broadwell
- Custom N1 16 vCPU 96GB Intel Broadwell
- Custom N1 20 vCPU 24GB Intel Broadwell
- Custom N1 20 vCPU 32GB Intel Broadwell
- Custom N1 20 vCPU 48GB Intel Broadwell
- Custom N1 20 vCPU 64GB Intel Broadwell
- Custom N1 20 vCPU 96GB Intel Broadwell
- Custom N1 20 vCPU 128GB Intel Broadwell
- Custom N1 24 vCPU 24GB Intel Broadwell
- Custom N1 24 vCPU 32GB Intel Broadwell
- Custom N1 24 vCPU 48GB Intel Broadwell
- Custom N1 24 vCPU 64GB Intel Broadwell
- Custom N1 24 vCPU 96GB Intel Broadwell
- Custom N1 24 vCPU 128GB Intel Broadwell
- Custom N1 28 vCPU 32GB Intel Broadwell
- Custom N1 28 vCPU 48GB Intel Broadwell
- Custom N1 28 vCPU 64GB Intel Broadwell
- Custom N1 28 vCPU 96GB Intel Broadwell
- Custom N1 28 vCPU 128GB Intel Broadwell
- Custom N1 28 vCPU 160GB Intel Broadwell
- Custom N1 32 vCPU 32GB Intel Broadwell
- Custom N1 32 vCPU 48GB Intel Broadwell
- Custom N1 32 vCPU 64GB Intel Broadwell
- Custom N1 32 vCPU 96GB Intel Broadwell
- Custom N1 32 vCPU 128GB Intel Broadwell
- Custom N1 32 vCPU 160GB Intel Broadwell
- Custom N1 32 vCPU 192GB Intel Broadwell
- Custom N1 48 vCPU 48GB Intel Broadwell
- Custom N1 48 vCPU 64GB Intel Broadwell
- Custom N1 48 vCPU 96GB Intel Broadwell
- Custom N1 48 vCPU 128GB Intel Broadwell
- Custom N1 48 vCPU 160GB Intel Broadwell
- Custom N1 48 vCPU 192GB Intel Broadwell
- Custom N1 48 vCPU 224GB Intel Broadwell
- Custom N1 48 vCPU 256GB Intel Broadwell
- Custom N1 56 vCPU 64GB Intel Broadwell
- Custom N1 56 vCPU 96GB Intel Broadwell
- Custom N1 56 vCPU 128GB Intel Broadwell
- Custom N1 56 vCPU 160GB Intel Broadwell
- Custom N1 56 vCPU 192GB Intel Broadwell
- Custom N1 56 vCPU 224GB Intel Broadwell
- Custom N1 56 vCPU 256GB Intel Broadwell
- Custom N1 56 vCPU 320GB Intel Broadwell
- Custom N1 64 vCPU 64GB Intel Broadwell
- Custom N1 64 vCPU 96GB Intel Broadwell
- Custom N1 64 vCPU 128GB Intel Broadwell
- Custom N1 64 vCPU 160GB Intel Broadwell
- Custom N1 64 vCPU 192GB Intel Broadwell
- Custom N1 64 vCPU 224GB Intel Broadwell
- Custom N1 64 vCPU 256GB Intel Broadwell
- Custom N1 64 vCPU 320GB Intel Broadwell
- Custom N1 64 vCPU 384GB Intel Broadwell
- Custom N1 64 vCPU 416GB Intel Broadwell
- Custom N1 80 vCPU 96GB Intel Broadwell
- Custom N1 80 vCPU 128GB Intel Broadwell
- Custom N1 80 vCPU 160GB Intel Broadwell
- Custom N1 80 vCPU 192GB Intel Broadwell
- Custom N1 80 vCPU 224GB Intel Broadwell
- Custom N1 80 vCPU 256GB Intel Broadwell
- Custom N1 80 vCPU 320GB Intel Broadwell
- Custom N1 80 vCPU 384GB Intel Broadwell
- Custom N1 80 vCPU 416GB Intel Broadwell
- Custom N1 80 vCPU 455GB Intel Broadwell
- Custom N1 80 vCPU 512GB Intel Broadwell
- Custom N1 88 vCPU 96GB Intel Broadwell
- Custom N1 88 vCPU 128GB Intel Broadwell
- Custom N1 88 vCPU 160GB Intel Broadwell
- Custom N1 88 vCPU 192GB Intel Broadwell
- Custom N1 88 vCPU 224GB Intel Broadwell
- Custom N1 88 vCPU 256GB Intel Broadwell
- Custom N1 88 vCPU 320GB Intel Broadwell
- Custom N1 88 vCPU 384GB Intel Broadwell
- Custom N1 88 vCPU 416GB Intel Broadwell
- Custom N1 88 vCPU 455GB Intel Broadwell
- Custom N1 88 vCPU 512GB Intel Broadwell
- Custom N1 96 vCPU 96GB Intel Broadwell
- Custom N1 96 vCPU 128GB Intel Broadwell
- Custom N1 96 vCPU 160GB Intel Broadwell
- Custom N1 96 vCPU 192GB Intel Broadwell
- Custom N1 96 vCPU 224GB Intel Broadwell
- Custom N1 96 vCPU 256GB Intel Broadwell
- Custom N1 96 vCPU 320GB Intel Broadwell
- Custom N1 96 vCPU 416GB Intel Broadwell
- Custom N1 96 vCPU 455GB Intel Broadwell
- Custom N1 96 vCPU 512GB Intel Broadwell