Custom N1 4 vCPU 8GB Intel Broadwell by Google Cloud
Geekbench is a cross-platform processor benchmark with a scoring system that determines single-core and multi-core performance using loads simulating real-world scenarios. Geekbench 5 score is calculated with a reference score of 2500 representing the performance of the Intel Core i5-2520M @ 2.50 GHz. The software benchmark is available for Mac OS, Windows, Linux, Android and iOS platforms.
Specifications:
CPU
4
RAM
8.0 GB
{
"configuration": {
"chart": {
"type": "scatter",
"polar": false,
"zoomType": "",
"options3d": {},
"height": null,
"width": null,
"margin": null,
"inverted": false,
"zooming": {}
},
"credits": {
"enabled": false
},
"title": {
"text": ""
},
"colorAxis": null,
"subtitle": {
"text": ""
},
"xAxis": {
"title": {
"text": [
"Single Score"
],
"useHTML": false,
"style": {
"color": "#666666"
}
},
"categories": null,
"lineWidth": 1,
"tickInterval": null,
"tickWidth": 1,
"tickLength": 10,
"tickPixelInterval": 100,
"plotLines": null,
"labels": {
"enabled": true,
"format": null,
"formatter": "",
"style": {
"color": "#666666",
"cursor": "default",
"fontSize": "11px"
},
"useHTML": false,
"step": 0
},
"plotBands": null,
"visible": true,
"floor": null,
"ceiling": null,
"type": "linear",
"min": 0,
"gridLineWidth": 1,
"gridLineColor": "#e6e6e6",
"minorTickInterval": null,
"minorTickWidth": 0,
"minTickInterval": null,
"startOnTick": true,
"endOnTick": true,
"tickmarkPlacement": 100,
"units": 100,
"minRange": 100
},
"yAxis": {
"title": {
"text": [
"Multi Score"
],
"useHTML": false,
"style": {
"color": "#666666"
}
},
"categories": null,
"plotLines": null,
"plotBands": null,
"lineWidth": null,
"tickInterval": null,
"tickLength": 10,
"floor": null,
"ceiling": null,
"gridLineInterpolation": null,
"gridLineWidth": 1,
"gridLineColor": "#e6e6e6",
"min": 0,
"max": null,
"minorTickInterval": null,
"minorTickWidth": 0,
"minTickInterval": null,
"startOnTick": true,
"endOnTick": true,
"minRange": null,
"type": "linear",
"tickmarkPlacement": null,
"labels": {
"enabled": true,
"formatter": null,
"style": {
"color": "#666666",
"cursor": "default",
"fontSize": "11px"
},
"useHTML": false
}
},
"zAxis": {
"title": {
"text": "Multi Score"
}
},
"plotOptions": {
"series": {
"dataLabels": {
"enabled": false,
"format": null,
"distance": 30,
"align": "center",
"inside": null,
"allowOverlap": false,
"style": {
"fontSize": "11px"
}
},
"showInLegend": null,
"turboThreshold": 0,
"stacking": "",
"groupPadding": 0.2,
"centerInCategory": false,
"findNearestPointBy": "x"
}
},
"navigator": {
"enabled": false
},
"scrollbar": {
"enabled": false
},
"rangeSelector": {
"enabled": false,
"inputEnabled": false
},
"legend": {
"enabled": null,
"maxHeight": null,
"align": "center",
"verticalAlign": "bottom",
"layout": "horizontal",
"width": null,
"margin": 12,
"reversed": false
},
"series": [
{
"name": "Custom N1 4 vCPU 8GB Intel Broadwell by Google Cloud",
"color": "#55b400",
"data": [
{
"x": 936.2091108936313,
"y": 2180.7101073507056
},
{
"x": 914.9674894861869,
"y": 2153.258251471475
},
{
"x": 935.7694832163235,
"y": 2180.732171599508
},
{
"x": 914.806429969292,
"y": 2152.253200232304
},
{
"x": 938.6662656344904,
"y": 2184.63909694448
},
{
"x": 913.5150894412823,
"y": 2153.3092862733497
},
{
"x": 934.929739755207,
"y": 2181.347424046379
},
{
"x": 915.2268089875865,
"y": 2155.2118094227462
},
{
"x": 934.2497833309574,
"y": 2181.308127022917
},
{
"x": 909.0650783986985,
"y": 2149.7085049286648
},
{
"x": 726.0758649329335,
"y": 1783.3829459161852
},
{
"x": 725.0379146016134,
"y": 1745.7973330534098
},
{
"x": 749.2746853346014,
"y": 1791.8695806833834
},
{
"x": 725.5780805663677,
"y": 1743.4803313384405
},
{
"x": 749.6272091809947,
"y": 1800.740894374004
},
{
"x": 717.1078629948784,
"y": 1736.556635304009
},
{
"x": 751.0027898184809,
"y": 1796.8884432339914
},
{
"x": 717.5985310825695,
"y": 1726.9171184616778
},
{
"x": 745.7248942349464,
"y": 1789.0910189022266
},
{
"x": 715.8215041663923,
"y": 1740.4043319765947
},
{
"x": 739.3922932209365,
"y": 1794.668026521454
},
{
"x": 717.781287774346,
"y": 1720.9222120468248
},
{
"x": 744.0912716782323,
"y": 1781.0115887957104
},
{
"x": 721.4864930577011,
"y": 1728.7205857643892
},
{
"x": 737.7418632920694,
"y": 1763.0990818511004
},
{
"x": 710.4454107281301,
"y": 1729.9743719978865
},
{
"x": 733.0121147881185,
"y": 1772.7595854274118
},
{
"x": 717.9858808425947,
"y": 1736.8961941954187
},
{
"x": 745.0858290939568,
"y": 1791.0488819021882
},
{
"x": 707.4986011489967,
"y": 1716.015605616437
}
]
}
],
"drilldown": {},
"tooltip": {
"enabled": true,
"useHTML": false,
"format": null,
"headerFormat": "",
"pointFormat": "<span style=\"color:{series.color}\">Single</span>: <b>{point.x:.0f}</b><br><span style=\"color:{series.color}\">Multi</span>: <b>{point.y:.0f}</b>",
"footerFormat": "",
"shared": false,
"outside": false,
"valueDecimals": null,
"split": false
},
"annotations": null
},
"hc_type": "chart",
"id": "113739264612177420456839199779129195561"
}
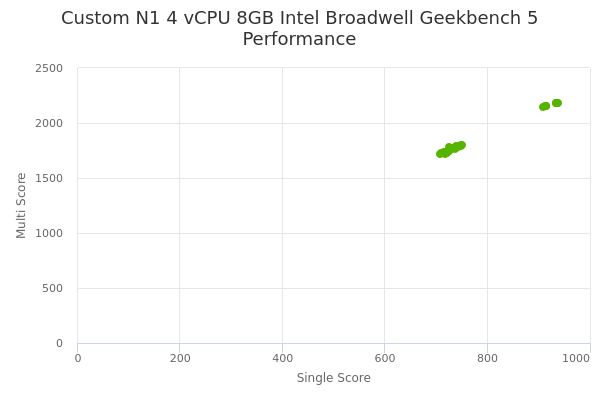
| Single | Multi | |
|---|---|---|
| Max | 939 | 2185 |
| Average | 795 | 1895 |
| Deviation | 92.80 | 193.82 |
| Min | 707 | 1716 |
Sign up as Freemium to get more insight.
- In same series
- Custom N1 1 vCPU 1GB Intel Broadwell
- Custom N1 1 vCPU 2GB Intel Broadwell
- Custom N1 1 vCPU 3GB Intel Broadwell
- Custom N1 1 vCPU 6GB Intel Broadwell
- Custom N1 2 vCPU 3GB Intel Broadwell
- Custom N1 2 vCPU 4GB Intel Broadwell
- Custom N1 2 vCPU 6GB Intel Broadwell
- Custom N1 2 vCPU 12GB Intel Broadwell
- Custom N1 3 vCPU 3GB Intel Broadwell
- Custom N1 3 vCPU 4GB Intel Broadwell
- Custom N1 3 vCPU 6GB Intel Broadwell
- Custom N1 3 vCPU 8GB Intel Broadwell
- Custom N1 3 vCPU 12GB Intel Broadwell
- Custom N1 3 vCPU 16GB Intel Broadwell
- Custom N1 4 vCPU 6GB Intel Broadwell
- Custom N1 4 vCPU 8GB Intel Broadwell
- Custom N1 4 vCPU 12GB Intel Broadwell
- Custom N1 4 vCPU 24GB Intel Broadwell
- Custom N1 6 vCPU 6GB Intel Broadwell
- Custom N1 6 vCPU 8GB Intel Broadwell
- Custom N1 6 vCPU 12GB Intel Broadwell
- Custom N1 6 vCPU 16GB Intel Broadwell
- Custom N1 6 vCPU 24GB Intel Broadwell
- Custom N1 6 vCPU 32GB Intel Broadwell
- Custom N1 8 vCPU 12GB Intel Broadwell
- Custom N1 8 vCPU 16GB Intel Broadwell
- Custom N1 8 vCPU 24GB Intel Broadwell
- Custom N1 8 vCPU 32GB Intel Broadwell
- Custom N1 8 vCPU 48GB Intel Broadwell
- Custom N1 10 vCPU 12GB Intel Broadwell
- Custom N1 10 vCPU 16GB Intel Broadwell
- Custom N1 10 vCPU 24GB Intel Broadwell
- Custom N1 10 vCPU 32GB Intel Broadwell
- Custom N1 10 vCPU 48GB Intel Broadwell
- Custom N1 10 vCPU 64GB Intel Broadwell
- Custom N1 12 vCPU 12GB Intel Broadwell
- Custom N1 12 vCPU 16GB Intel Broadwell
- Custom N1 12 vCPU 24GB Intel Broadwell
- Custom N1 12 vCPU 32GB Intel Broadwell
- Custom N1 12 vCPU 48GB Intel Broadwell
- Custom N1 12 vCPU 64GB Intel Broadwell
- Custom N1 16 vCPU 16GB Intel Broadwell
- Custom N1 16 vCPU 24GB Intel Broadwell
- Custom N1 16 vCPU 32GB Intel Broadwell
- Custom N1 16 vCPU 48GB Intel Broadwell
- Custom N1 16 vCPU 64GB Intel Broadwell
- Custom N1 16 vCPU 96GB Intel Broadwell
- Custom N1 20 vCPU 24GB Intel Broadwell
- Custom N1 20 vCPU 32GB Intel Broadwell
- Custom N1 20 vCPU 48GB Intel Broadwell
- Custom N1 20 vCPU 64GB Intel Broadwell
- Custom N1 20 vCPU 96GB Intel Broadwell
- Custom N1 20 vCPU 128GB Intel Broadwell
- Custom N1 24 vCPU 24GB Intel Broadwell
- Custom N1 24 vCPU 32GB Intel Broadwell
- Custom N1 24 vCPU 48GB Intel Broadwell
- Custom N1 24 vCPU 64GB Intel Broadwell
- Custom N1 24 vCPU 96GB Intel Broadwell
- Custom N1 24 vCPU 128GB Intel Broadwell
- Custom N1 28 vCPU 32GB Intel Broadwell
- Custom N1 28 vCPU 48GB Intel Broadwell
- Custom N1 28 vCPU 64GB Intel Broadwell
- Custom N1 28 vCPU 96GB Intel Broadwell
- Custom N1 28 vCPU 128GB Intel Broadwell
- Custom N1 28 vCPU 160GB Intel Broadwell
- Custom N1 32 vCPU 32GB Intel Broadwell
- Custom N1 32 vCPU 48GB Intel Broadwell
- Custom N1 32 vCPU 64GB Intel Broadwell
- Custom N1 32 vCPU 96GB Intel Broadwell
- Custom N1 32 vCPU 128GB Intel Broadwell
- Custom N1 32 vCPU 160GB Intel Broadwell
- Custom N1 32 vCPU 192GB Intel Broadwell
- Custom N1 48 vCPU 48GB Intel Broadwell
- Custom N1 48 vCPU 64GB Intel Broadwell
- Custom N1 48 vCPU 96GB Intel Broadwell
- Custom N1 48 vCPU 128GB Intel Broadwell
- Custom N1 48 vCPU 160GB Intel Broadwell
- Custom N1 48 vCPU 192GB Intel Broadwell
- Custom N1 48 vCPU 224GB Intel Broadwell
- Custom N1 48 vCPU 256GB Intel Broadwell
- Custom N1 56 vCPU 64GB Intel Broadwell
- Custom N1 56 vCPU 96GB Intel Broadwell
- Custom N1 56 vCPU 128GB Intel Broadwell
- Custom N1 56 vCPU 160GB Intel Broadwell
- Custom N1 56 vCPU 192GB Intel Broadwell
- Custom N1 56 vCPU 224GB Intel Broadwell
- Custom N1 56 vCPU 256GB Intel Broadwell
- Custom N1 56 vCPU 320GB Intel Broadwell
- Custom N1 64 vCPU 64GB Intel Broadwell
- Custom N1 64 vCPU 96GB Intel Broadwell
- Custom N1 64 vCPU 128GB Intel Broadwell
- Custom N1 64 vCPU 160GB Intel Broadwell
- Custom N1 64 vCPU 192GB Intel Broadwell
- Custom N1 64 vCPU 224GB Intel Broadwell
- Custom N1 64 vCPU 256GB Intel Broadwell
- Custom N1 64 vCPU 320GB Intel Broadwell
- Custom N1 64 vCPU 384GB Intel Broadwell
- Custom N1 64 vCPU 416GB Intel Broadwell
- Custom N1 80 vCPU 96GB Intel Broadwell
- Custom N1 80 vCPU 128GB Intel Broadwell
- Custom N1 80 vCPU 160GB Intel Broadwell
- Custom N1 80 vCPU 192GB Intel Broadwell
- Custom N1 80 vCPU 224GB Intel Broadwell
- Custom N1 80 vCPU 256GB Intel Broadwell
- Custom N1 80 vCPU 320GB Intel Broadwell
- Custom N1 80 vCPU 384GB Intel Broadwell
- Custom N1 80 vCPU 416GB Intel Broadwell
- Custom N1 80 vCPU 455GB Intel Broadwell
- Custom N1 80 vCPU 512GB Intel Broadwell
- Custom N1 88 vCPU 96GB Intel Broadwell
- Custom N1 88 vCPU 128GB Intel Broadwell
- Custom N1 88 vCPU 160GB Intel Broadwell
- Custom N1 88 vCPU 192GB Intel Broadwell
- Custom N1 88 vCPU 224GB Intel Broadwell
- Custom N1 88 vCPU 256GB Intel Broadwell
- Custom N1 88 vCPU 320GB Intel Broadwell
- Custom N1 88 vCPU 384GB Intel Broadwell
- Custom N1 88 vCPU 416GB Intel Broadwell
- Custom N1 88 vCPU 455GB Intel Broadwell
- Custom N1 88 vCPU 512GB Intel Broadwell
- Custom N1 96 vCPU 96GB Intel Broadwell
- Custom N1 96 vCPU 128GB Intel Broadwell
- Custom N1 96 vCPU 160GB Intel Broadwell
- Custom N1 96 vCPU 192GB Intel Broadwell
- Custom N1 96 vCPU 224GB Intel Broadwell
- Custom N1 96 vCPU 256GB Intel Broadwell
- Custom N1 96 vCPU 320GB Intel Broadwell
- Custom N1 96 vCPU 416GB Intel Broadwell
- Custom N1 96 vCPU 455GB Intel Broadwell
- Custom N1 96 vCPU 512GB Intel Broadwell