c2-standard-8 Intel Cascade Lake by Google Cloud
Geekbench is a cross-platform processor benchmark with a scoring system that determines single-core and multi-core performance using loads simulating real-world scenarios. Geekbench 5 score is calculated with a reference score of 2500 representing the performance of the Intel Core i5-2520M @ 2.50 GHz. The software benchmark is available for Mac OS, Windows, Linux, Android and iOS platforms.
Specifications:
CPU
8
RAM
32.0 GB
{
"configuration": {
"chart": {
"type": "scatter",
"polar": false,
"zoomType": "",
"options3d": {},
"height": null,
"width": null,
"margin": null,
"inverted": false,
"zooming": {}
},
"credits": {
"enabled": false
},
"title": {
"text": ""
},
"colorAxis": null,
"subtitle": {
"text": ""
},
"xAxis": {
"title": {
"text": [
"Single Score"
],
"useHTML": false,
"style": {
"color": "#666666"
}
},
"categories": null,
"lineWidth": 1,
"tickInterval": null,
"tickWidth": 1,
"tickLength": 10,
"tickPixelInterval": 100,
"plotLines": null,
"labels": {
"enabled": true,
"format": null,
"formatter": "",
"style": {
"color": "#666666",
"cursor": "default",
"fontSize": "11px"
},
"useHTML": false,
"step": 0
},
"plotBands": null,
"visible": true,
"floor": null,
"ceiling": null,
"type": "linear",
"min": 0,
"gridLineWidth": 1,
"gridLineColor": "#e6e6e6",
"minorTickInterval": null,
"minorTickWidth": 0,
"minTickInterval": null,
"startOnTick": true,
"endOnTick": true,
"tickmarkPlacement": 100,
"units": 100,
"minRange": 100
},
"yAxis": {
"title": {
"text": [
"Multi Score"
],
"useHTML": false,
"style": {
"color": "#666666"
}
},
"categories": null,
"plotLines": null,
"plotBands": null,
"lineWidth": null,
"tickInterval": null,
"tickLength": 10,
"floor": null,
"ceiling": null,
"gridLineInterpolation": null,
"gridLineWidth": 1,
"gridLineColor": "#e6e6e6",
"min": 0,
"max": null,
"minorTickInterval": null,
"minorTickWidth": 0,
"minTickInterval": null,
"startOnTick": true,
"endOnTick": true,
"minRange": null,
"type": "linear",
"tickmarkPlacement": null,
"labels": {
"enabled": true,
"formatter": null,
"style": {
"color": "#666666",
"cursor": "default",
"fontSize": "11px"
},
"useHTML": false
}
},
"zAxis": {
"title": {
"text": "Multi Score"
}
},
"plotOptions": {
"series": {
"dataLabels": {
"enabled": false,
"format": null,
"distance": 30,
"align": "center",
"inside": null,
"allowOverlap": false,
"style": {
"fontSize": "11px"
}
},
"showInLegend": null,
"turboThreshold": 0,
"stacking": "",
"groupPadding": 0.2,
"centerInCategory": false,
"findNearestPointBy": "x"
}
},
"navigator": {
"enabled": false
},
"scrollbar": {
"enabled": false
},
"rangeSelector": {
"enabled": false,
"inputEnabled": false
},
"legend": {
"enabled": null,
"maxHeight": null,
"align": "center",
"verticalAlign": "bottom",
"layout": "horizontal",
"width": null,
"margin": 12,
"reversed": false
},
"series": [
{
"name": "c2-standard-8 Intel Cascade Lake by Google Cloud",
"color": "#55b400",
"data": [
{
"x": 1052.33674341908,
"y": 4807.570919054741
},
{
"x": 1045.686109168856,
"y": 4793.270163528727
},
{
"x": 1054.5031733147064,
"y": 4801.58892441351
},
{
"x": 1049.683585804042,
"y": 4783.736641886336
},
{
"x": 1053.3600798780622,
"y": 4809.8576909228705
},
{
"x": 1032.792012584677,
"y": 4809.843601227773
},
{
"x": 1052.8679638152107,
"y": 4800.568897732068
},
{
"x": 1054.2076955162609,
"y": 4812.315265688127
},
{
"x": 1053.7573220138847,
"y": 4806.0642856245695
},
{
"x": 1054.8620581970504,
"y": 4811.983472838695
},
{
"x": 1053.3102546349137,
"y": 4807.076603321493
},
{
"x": 1053.9092464388057,
"y": 4812.138096136378
},
{
"x": 1052.9874922101314,
"y": 4810.265025512256
},
{
"x": 1053.9528227359153,
"y": 4796.565569649363
},
{
"x": 1052.947173529221,
"y": 4796.436969410439
},
{
"x": 1052.8842164779035,
"y": 4809.70774700113
},
{
"x": 1052.161460087687,
"y": 4813.963424941175
},
{
"x": 1054.1068214133993,
"y": 4817.816180199441
},
{
"x": 1053.8344633878316,
"y": 4803.500845837892
},
{
"x": 1053.7660541675004,
"y": 4804.400820711175
},
{
"x": 1033.144623202265,
"y": 4779.508088758288
},
{
"x": 1023.9637764791362,
"y": 4743.551793574734
},
{
"x": 1039.6998139727448,
"y": 4787.677097644701
},
{
"x": 1026.596502248913,
"y": 4756.941599659997
},
{
"x": 1041.1060274519627,
"y": 4779.556468693216
},
{
"x": 1025.7157867133715,
"y": 4744.721873479672
},
{
"x": 1037.9972703469648,
"y": 4779.919125613185
},
{
"x": 1024.8232259401702,
"y": 4758.517333799084
},
{
"x": 1039.0642611950907,
"y": 4765.709987585582
},
{
"x": 1024.8253931304919,
"y": 4745.252906805631
},
{
"x": 1038.3448459778347,
"y": 4774.974696679494
},
{
"x": 1026.7676949355039,
"y": 4747.809552749307
},
{
"x": 1037.9215608797306,
"y": 4786.217923604537
},
{
"x": 1025.5350590864405,
"y": 4745.177356204427
},
{
"x": 1040.5990247669292,
"y": 4788.4791274647
},
{
"x": 1026.7147688924617,
"y": 4739.359240916852
},
{
"x": 1039.2528090204949,
"y": 4780.685872786221
},
{
"x": 1026.6114308424715,
"y": 4749.855758383851
},
{
"x": 1039.4535262478337,
"y": 4779.916810001455
},
{
"x": 1023.9219339582664,
"y": 4750.295602118135
}
]
}
],
"drilldown": {},
"tooltip": {
"enabled": true,
"useHTML": false,
"format": null,
"headerFormat": "",
"pointFormat": "<span style=\"color:{series.color}\">Single</span>: <b>{point.x:.0f}</b><br><span style=\"color:{series.color}\">Multi</span>: <b>{point.y:.0f}</b>",
"footerFormat": "",
"shared": false,
"outside": false,
"valueDecimals": null,
"split": false
},
"annotations": null
},
"hc_type": "chart",
"id": "293102491149414856509626170074972798314"
}
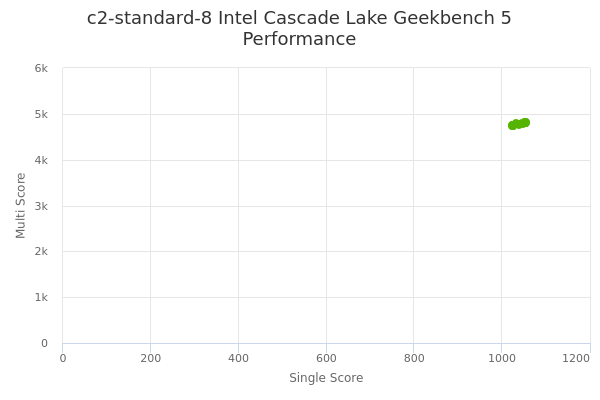
| Single | Multi | |
|---|---|---|
| Max | 1055 | 4818 |
| Average | 1042 | 4785 |
| Deviation | 11.50 | 24.57 |
| Min | 1024 | 4739 |
Sign up as Freemium to get more insight.