c2-standard-16 Intel Cascade Lake by Google Cloud
Geekbench is a cross-platform processor benchmark with a scoring system that determines single-core and multi-core performance using loads simulating real-world scenarios. Geekbench 5 score is calculated with a reference score of 2500 representing the performance of the Intel Core i5-2520M @ 2.50 GHz. The software benchmark is available for Mac OS, Windows, Linux, Android and iOS platforms.
Specifications:
CPU
16
RAM
64.0 GB
{
"configuration": {
"chart": {
"type": "scatter",
"polar": false,
"zoomType": "",
"options3d": {},
"height": null,
"width": null,
"margin": null,
"inverted": false,
"zooming": {}
},
"credits": {
"enabled": false
},
"title": {
"text": ""
},
"colorAxis": null,
"subtitle": {
"text": ""
},
"xAxis": {
"title": {
"text": [
"Single Score"
],
"useHTML": false,
"style": {
"color": "#666666"
}
},
"categories": null,
"lineWidth": 1,
"tickInterval": null,
"tickWidth": 1,
"tickLength": 10,
"tickPixelInterval": 100,
"plotLines": null,
"labels": {
"enabled": true,
"format": null,
"formatter": "",
"style": {
"color": "#666666",
"cursor": "default",
"fontSize": "11px"
},
"useHTML": false,
"step": 0
},
"plotBands": null,
"visible": true,
"floor": null,
"ceiling": null,
"type": "linear",
"min": 0,
"gridLineWidth": 1,
"gridLineColor": "#e6e6e6",
"minorTickInterval": null,
"minorTickWidth": 0,
"minTickInterval": null,
"startOnTick": true,
"endOnTick": true,
"tickmarkPlacement": 100,
"units": 100,
"minRange": 100
},
"yAxis": {
"title": {
"text": [
"Multi Score"
],
"useHTML": false,
"style": {
"color": "#666666"
}
},
"categories": null,
"plotLines": null,
"plotBands": null,
"lineWidth": null,
"tickInterval": null,
"tickLength": 10,
"floor": null,
"ceiling": null,
"gridLineInterpolation": null,
"gridLineWidth": 1,
"gridLineColor": "#e6e6e6",
"min": 0,
"max": null,
"minorTickInterval": null,
"minorTickWidth": 0,
"minTickInterval": null,
"startOnTick": true,
"endOnTick": true,
"minRange": null,
"type": "linear",
"tickmarkPlacement": null,
"labels": {
"enabled": true,
"formatter": null,
"style": {
"color": "#666666",
"cursor": "default",
"fontSize": "11px"
},
"useHTML": false
}
},
"zAxis": {
"title": {
"text": "Multi Score"
}
},
"plotOptions": {
"series": {
"dataLabels": {
"enabled": false,
"format": null,
"distance": 30,
"align": "center",
"inside": null,
"allowOverlap": false,
"style": {
"fontSize": "11px"
}
},
"showInLegend": null,
"turboThreshold": 0,
"stacking": "",
"groupPadding": 0.2,
"centerInCategory": false,
"findNearestPointBy": "x"
}
},
"navigator": {
"enabled": false
},
"scrollbar": {
"enabled": false
},
"rangeSelector": {
"enabled": false,
"inputEnabled": false
},
"legend": {
"enabled": null,
"maxHeight": null,
"align": "center",
"verticalAlign": "bottom",
"layout": "horizontal",
"width": null,
"margin": 12,
"reversed": false
},
"series": [
{
"name": "c2-standard-16 Intel Cascade Lake by Google Cloud",
"color": "#55b400",
"data": [
{
"x": 1037.5740625686483,
"y": 9167.804894261997
},
{
"x": 1040.5131514639884,
"y": 9167.183893552
},
{
"x": 1038.8732095273135,
"y": 9184.96684876686
},
{
"x": 1039.5176804486987,
"y": 9141.886487694032
},
{
"x": 1039.4187546681146,
"y": 9171.453630325548
},
{
"x": 1038.6393303582502,
"y": 9155.313972609003
},
{
"x": 1038.5664823366371,
"y": 9169.33907676625
},
{
"x": 1037.264811547846,
"y": 9171.9692550449
},
{
"x": 1038.2114033289795,
"y": 9155.992733298976
},
{
"x": 1038.538922343509,
"y": 9154.071907233256
},
{
"x": 1042.0311263635003,
"y": 9147.53755972666
},
{
"x": 1036.8687231356566,
"y": 9115.698629163015
},
{
"x": 1033.3573392742605,
"y": 9149.295388997172
},
{
"x": 1016.0204697225643,
"y": 9072.017026858017
},
{
"x": 1038.0731051733178,
"y": 9188.38697547334
},
{
"x": 1009.7853463875673,
"y": 9065.185377389822
},
{
"x": 1039.2104440656692,
"y": 9159.76205475471
},
{
"x": 1011.3248914531823,
"y": 9127.37641155317
},
{
"x": 1037.1492035298338,
"y": 9181.177498544015
},
{
"x": 1038.4991558817574,
"y": 9160.625919256152
}
]
}
],
"drilldown": {},
"tooltip": {
"enabled": true,
"useHTML": false,
"format": null,
"headerFormat": "",
"pointFormat": "<span style=\"color:{series.color}\">Single</span>: <b>{point.x:.0f}</b><br><span style=\"color:{series.color}\">Multi</span>: <b>{point.y:.0f}</b>",
"footerFormat": "",
"shared": false,
"outside": false,
"valueDecimals": null,
"split": false
},
"annotations": null
},
"hc_type": "chart",
"id": "140867291316915686006487447707186149949"
}
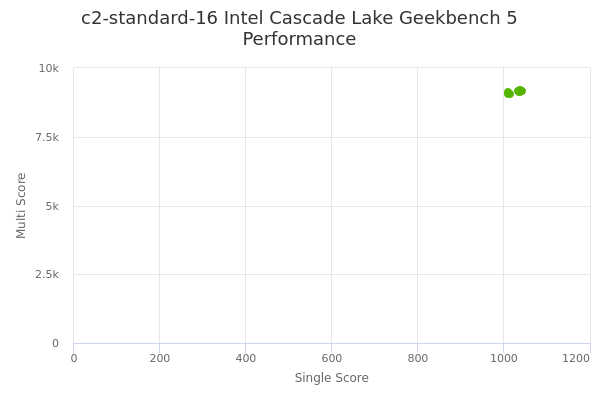
| Single | Multi | |
|---|---|---|
| Max | 1042 | 9188 |
| Average | 1034 | 9150 |
| Deviation | 9.48 | 32.34 |
| Min | 1010 | 9065 |
Sign up as Freemium to get more insight.