c6asx.large by Genesis Hosting Solutions
Geekbench is a cross-platform processor benchmark with a scoring system that determines single-core and multi-core performance using loads simulating real-world scenarios. Geekbench 5 score is calculated with a reference score of 2500 representing the performance of the Intel Core i5-2520M @ 2.50 GHz. The software benchmark is available for Mac OS, Windows, Linux, Android and iOS platforms.
Specifications:
CPU
1
RAM
4.0 GB
Root
100 GB
Root c6asx.large
{
"configuration": {
"chart": {
"type": "scatter",
"polar": false,
"zoomType": "",
"options3d": {},
"height": null,
"width": null,
"margin": null,
"inverted": false,
"zooming": {}
},
"credits": {
"enabled": false
},
"title": {
"text": ""
},
"colorAxis": null,
"subtitle": {
"text": ""
},
"xAxis": {
"title": {
"text": [
"Single Score"
],
"useHTML": false,
"style": {
"color": "#666666"
}
},
"categories": null,
"lineWidth": 1,
"tickInterval": null,
"tickWidth": 1,
"tickLength": 10,
"tickPixelInterval": 100,
"plotLines": null,
"labels": {
"enabled": true,
"format": null,
"formatter": "",
"style": {
"color": "#666666",
"cursor": "default",
"fontSize": "11px"
},
"useHTML": false,
"step": 0
},
"plotBands": null,
"visible": true,
"floor": null,
"ceiling": null,
"type": "linear",
"min": 0,
"gridLineWidth": 1,
"gridLineColor": "#e6e6e6",
"minorTickInterval": null,
"minorTickWidth": 0,
"minTickInterval": null,
"startOnTick": true,
"endOnTick": true,
"tickmarkPlacement": 100,
"units": 100,
"minRange": 100
},
"yAxis": {
"title": {
"text": [
"Multi Score"
],
"useHTML": false,
"style": {
"color": "#666666"
}
},
"categories": null,
"plotLines": null,
"plotBands": null,
"lineWidth": null,
"tickInterval": null,
"tickLength": 10,
"floor": null,
"ceiling": null,
"gridLineInterpolation": null,
"gridLineWidth": 1,
"gridLineColor": "#e6e6e6",
"min": 0,
"max": null,
"minorTickInterval": null,
"minorTickWidth": 0,
"minTickInterval": null,
"startOnTick": true,
"endOnTick": true,
"minRange": null,
"type": "linear",
"tickmarkPlacement": null,
"labels": {
"enabled": true,
"formatter": null,
"style": {
"color": "#666666",
"cursor": "default",
"fontSize": "11px"
},
"useHTML": false
}
},
"zAxis": {
"title": {
"text": "Multi Score"
}
},
"plotOptions": {
"series": {
"dataLabels": {
"enabled": false,
"format": null,
"distance": 30,
"align": "center",
"inside": null,
"allowOverlap": false,
"style": {
"fontSize": "11px"
}
},
"showInLegend": null,
"turboThreshold": 0,
"stacking": "",
"groupPadding": 0.2,
"centerInCategory": false,
"findNearestPointBy": "x"
}
},
"navigator": {
"enabled": false
},
"scrollbar": {
"enabled": false
},
"rangeSelector": {
"enabled": false,
"inputEnabled": false
},
"legend": {
"enabled": null,
"maxHeight": null,
"align": "center",
"verticalAlign": "bottom",
"layout": "horizontal",
"width": null,
"margin": 12,
"reversed": false
},
"series": [
{
"name": "c6asx.large by Genesis Hosting Solutions",
"color": "#c16b28",
"data": [
{
"x": 999.1328062759103,
"y": 969.4214287464763
},
{
"x": 974.7359559419526,
"y": 939.5749623780466
},
{
"x": 996.6913077120363,
"y": 982.9049026603034
},
{
"x": 966.2065129756415,
"y": 964.918394061764
},
{
"x": 989.8013175775716,
"y": 989.8086515332566
},
{
"x": 988.9094862305758,
"y": 964.5470723931167
},
{
"x": 1012.9166761857236,
"y": 1018.6809977277658
},
{
"x": 979.8103033389812,
"y": 947.9608051423783
},
{
"x": 1026.7434020301002,
"y": 1019.322023034381
},
{
"x": 998.0092881813268,
"y": 950.1623764942526
},
{
"x": 1011.2332510491344,
"y": 967.2577202931436
},
{
"x": 994.2121294621813,
"y": 925.619554605669
},
{
"x": 1016.8109164706766,
"y": 974.6952168917686
},
{
"x": 975.116351860059,
"y": 941.3263263588234
},
{
"x": 1005.5104448591098,
"y": 939.0983955981121
},
{
"x": 984.2794271345992,
"y": 953.6291032080051
},
{
"x": 998.9463911047436,
"y": 936.6315556933396
},
{
"x": 987.8274334429877,
"y": 947.8798240854746
},
{
"x": 1003.8820942929258,
"y": 952.5322986129914
},
{
"x": 982.4229587952859,
"y": 951.7980016622365
}
]
}
],
"drilldown": {},
"tooltip": {
"enabled": true,
"useHTML": false,
"format": null,
"headerFormat": "",
"pointFormat": "<span style=\"color:{series.color}\">Single</span>: <b>{point.x:.0f}</b><br><span style=\"color:{series.color}\">Multi</span>: <b>{point.y:.0f}</b>",
"footerFormat": "",
"shared": false,
"outside": false,
"valueDecimals": null,
"split": false
},
"annotations": null
},
"hc_type": "chart",
"id": "121468912145043781229409482961034106743"
}
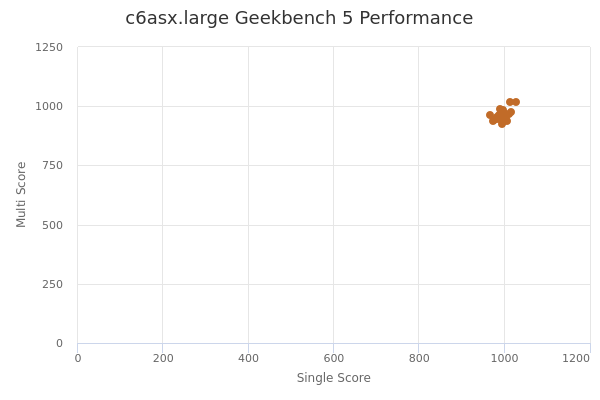
| Single | Multi | |
|---|---|---|
| Max | 1027 | 1019 |
| Average | 995 | 962 |
| Deviation | 15.09 | 24.69 |
| Min | 966 | 926 |
Sign up as Freemium to get more insight.