c6asx.4xlarge by Genesis Hosting Solutions
Geekbench is a cross-platform processor benchmark with a scoring system that determines single-core and multi-core performance using loads simulating real-world scenarios. Geekbench 5 score is calculated with a reference score of 2500 representing the performance of the Intel Core i5-2520M @ 2.50 GHz. The software benchmark is available for Mac OS, Windows, Linux, Android and iOS platforms.
Specifications:
CPU
8
RAM
32.0 GB
Root
800 GB
Root c6asx.4xlarge
{
"configuration": {
"chart": {
"type": "scatter",
"polar": false,
"zoomType": "",
"options3d": {},
"height": null,
"width": null,
"margin": null,
"inverted": false,
"zooming": {}
},
"credits": {
"enabled": false
},
"title": {
"text": ""
},
"colorAxis": null,
"subtitle": {
"text": ""
},
"xAxis": {
"title": {
"text": [
"Single Score"
],
"useHTML": false,
"style": {
"color": "#666666"
}
},
"categories": null,
"lineWidth": 1,
"tickInterval": null,
"tickWidth": 1,
"tickLength": 10,
"tickPixelInterval": 100,
"plotLines": null,
"labels": {
"enabled": true,
"format": null,
"formatter": "",
"style": {
"color": "#666666",
"cursor": "default",
"fontSize": "11px"
},
"useHTML": false,
"step": 0
},
"plotBands": null,
"visible": true,
"floor": null,
"ceiling": null,
"type": "linear",
"min": 0,
"gridLineWidth": 1,
"gridLineColor": "#e6e6e6",
"minorTickInterval": null,
"minorTickWidth": 0,
"minTickInterval": null,
"startOnTick": true,
"endOnTick": true,
"tickmarkPlacement": 100,
"units": 100,
"minRange": 100
},
"yAxis": {
"title": {
"text": [
"Multi Score"
],
"useHTML": false,
"style": {
"color": "#666666"
}
},
"categories": null,
"plotLines": null,
"plotBands": null,
"lineWidth": null,
"tickInterval": null,
"tickLength": 10,
"floor": null,
"ceiling": null,
"gridLineInterpolation": null,
"gridLineWidth": 1,
"gridLineColor": "#e6e6e6",
"min": 0,
"max": null,
"minorTickInterval": null,
"minorTickWidth": 0,
"minTickInterval": null,
"startOnTick": true,
"endOnTick": true,
"minRange": null,
"type": "linear",
"tickmarkPlacement": null,
"labels": {
"enabled": true,
"formatter": null,
"style": {
"color": "#666666",
"cursor": "default",
"fontSize": "11px"
},
"useHTML": false
}
},
"zAxis": {
"title": {
"text": "Multi Score"
}
},
"plotOptions": {
"series": {
"dataLabels": {
"enabled": false,
"format": null,
"distance": 30,
"align": "center",
"inside": null,
"allowOverlap": false,
"style": {
"fontSize": "11px"
}
},
"showInLegend": null,
"turboThreshold": 0,
"stacking": "",
"groupPadding": 0.2,
"centerInCategory": false,
"findNearestPointBy": "x"
}
},
"navigator": {
"enabled": false
},
"scrollbar": {
"enabled": false
},
"rangeSelector": {
"enabled": false,
"inputEnabled": false
},
"legend": {
"enabled": null,
"maxHeight": null,
"align": "center",
"verticalAlign": "bottom",
"layout": "horizontal",
"width": null,
"margin": 12,
"reversed": false
},
"series": [
{
"name": "c6asx.4xlarge by Genesis Hosting Solutions",
"color": "#c16b28",
"data": [
{
"x": 1017.6740202783001,
"y": 6847.192256062167
},
{
"x": 1017.2079388312452,
"y": 6440.758856006112
},
{
"x": 1024.6442540775622,
"y": 6731.005878178655
},
{
"x": 1015.3468128623363,
"y": 6531.363132856184
},
{
"x": 1019.2175342869748,
"y": 6907.287379758794
},
{
"x": 1007.7876354974683,
"y": 6286.454977404827
},
{
"x": 1002.5284535739708,
"y": 6351.2173323845445
},
{
"x": 1019.1981212779583,
"y": 6777.049916994359
},
{
"x": 1013.5111873470973,
"y": 6680.623946648027
},
{
"x": 999.4693988184797,
"y": 6484.19648183392
},
{
"x": 1019.5078578931935,
"y": 6735.83434511536
},
{
"x": 986.1500008037747,
"y": 6579.316251429864
},
{
"x": 1018.1107858815936,
"y": 6622.256874526009
},
{
"x": 1003.4015744520623,
"y": 6481.888839246869
},
{
"x": 1017.0748510040333,
"y": 6671.512127699665
},
{
"x": 997.1663811366033,
"y": 6431.099371729472
},
{
"x": 1021.6901565891887,
"y": 6989.448803692882
},
{
"x": 1000.4053706574236,
"y": 6595.414992285358
},
{
"x": 1009.6878758808894,
"y": 6814.366959674666
},
{
"x": 1006.5529810019876,
"y": 6514.215757707195
},
{
"x": 987.6670691245997,
"y": 6395.5252511158815
},
{
"x": 996.099051787492,
"y": 6443.4104049086545
},
{
"x": 993.9618108482248,
"y": 6231.925237763204
},
{
"x": 996.9496246938659,
"y": 6315.716593382139
},
{
"x": 1002.4857489851479,
"y": 6362.302564601554
},
{
"x": 994.4336078553993,
"y": 6266.084169596303
},
{
"x": 998.4980103718093,
"y": 6504.387934346463
},
{
"x": 1008.9768889849577,
"y": 6734.918812893726
},
{
"x": 1002.9254264202194,
"y": 6614.265563664749
},
{
"x": 1000.5662233991815,
"y": 6297.782422258968
},
{
"x": 1001.7443267874355,
"y": 6608.455296701339
},
{
"x": 997.7363796467032,
"y": 6538.968725160004
},
{
"x": 993.6196859248621,
"y": 6327.56351229605
},
{
"x": 1007.2478889262175,
"y": 6330.633436523556
},
{
"x": 991.8002013098492,
"y": 6329.343205010129
},
{
"x": 1004.450684938821,
"y": 6212.599211356493
},
{
"x": 998.3838170449967,
"y": 6266.333623707149
},
{
"x": 997.6225735535425,
"y": 6395.714814186117
},
{
"x": 994.9175367484843,
"y": 6443.036986912244
},
{
"x": 991.3337014003611,
"y": 6459.201151739859
}
]
}
],
"drilldown": {},
"tooltip": {
"enabled": true,
"useHTML": false,
"format": null,
"headerFormat": "",
"pointFormat": "<span style=\"color:{series.color}\">Single</span>: <b>{point.x:.0f}</b><br><span style=\"color:{series.color}\">Multi</span>: <b>{point.y:.0f}</b>",
"footerFormat": "",
"shared": false,
"outside": false,
"valueDecimals": null,
"split": false
},
"annotations": null
},
"hc_type": "chart",
"id": "191219079243052078518694428421868665866"
}
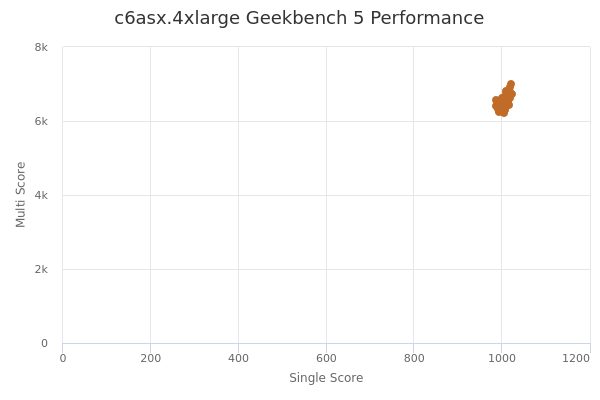
| Single | Multi | |
|---|---|---|
| Max | 1025 | 6989 |
| Average | 1004 | 6514 |
| Deviation | 10.13 | 195.56 |
| Min | 986 | 6213 |
Sign up as Freemium to get more insight.