c6asx.8xlarge by Genesis Hosting Solutions
Geekbench is a cross-platform processor benchmark with a scoring system that determines single-core and multi-core performance using loads simulating real-world scenarios. Geekbench 5 score is calculated with a reference score of 2500 representing the performance of the Intel Core i5-2520M @ 2.50 GHz. The software benchmark is available for Mac OS, Windows, Linux, Android and iOS platforms.
Specifications:
CPU
16
RAM
64.0 GB
Root
1600 GB
Root c6asx.8xlarge
{
"configuration": {
"chart": {
"type": "scatter",
"polar": false,
"zoomType": "",
"options3d": {},
"height": null,
"width": null,
"margin": null,
"inverted": false,
"zooming": {}
},
"credits": {
"enabled": false
},
"title": {
"text": ""
},
"colorAxis": null,
"subtitle": {
"text": ""
},
"xAxis": {
"title": {
"text": [
"Single Score"
],
"useHTML": false,
"style": {
"color": "#666666"
}
},
"categories": null,
"lineWidth": 1,
"tickInterval": null,
"tickWidth": 1,
"tickLength": 10,
"tickPixelInterval": 100,
"plotLines": null,
"labels": {
"enabled": true,
"format": null,
"formatter": "",
"style": {
"color": "#666666",
"cursor": "default",
"fontSize": "11px"
},
"useHTML": false,
"step": 0
},
"plotBands": null,
"visible": true,
"floor": null,
"ceiling": null,
"type": "linear",
"min": 0,
"gridLineWidth": 1,
"gridLineColor": "#e6e6e6",
"minorTickInterval": null,
"minorTickWidth": 0,
"minTickInterval": null,
"startOnTick": true,
"endOnTick": true,
"tickmarkPlacement": 100,
"units": 100,
"minRange": 100
},
"yAxis": {
"title": {
"text": [
"Multi Score"
],
"useHTML": false,
"style": {
"color": "#666666"
}
},
"categories": null,
"plotLines": null,
"plotBands": null,
"lineWidth": null,
"tickInterval": null,
"tickLength": 10,
"floor": null,
"ceiling": null,
"gridLineInterpolation": null,
"gridLineWidth": 1,
"gridLineColor": "#e6e6e6",
"min": 0,
"max": null,
"minorTickInterval": null,
"minorTickWidth": 0,
"minTickInterval": null,
"startOnTick": true,
"endOnTick": true,
"minRange": null,
"type": "linear",
"tickmarkPlacement": null,
"labels": {
"enabled": true,
"formatter": null,
"style": {
"color": "#666666",
"cursor": "default",
"fontSize": "11px"
},
"useHTML": false
}
},
"zAxis": {
"title": {
"text": "Multi Score"
}
},
"plotOptions": {
"series": {
"dataLabels": {
"enabled": false,
"format": null,
"distance": 30,
"align": "center",
"inside": null,
"allowOverlap": false,
"style": {
"fontSize": "11px"
}
},
"showInLegend": null,
"turboThreshold": 0,
"stacking": "",
"groupPadding": 0.2,
"centerInCategory": false,
"findNearestPointBy": "x"
}
},
"navigator": {
"enabled": false
},
"scrollbar": {
"enabled": false
},
"rangeSelector": {
"enabled": false,
"inputEnabled": false
},
"legend": {
"enabled": null,
"maxHeight": null,
"align": "center",
"verticalAlign": "bottom",
"layout": "horizontal",
"width": null,
"margin": 12,
"reversed": false
},
"series": [
{
"name": "c6asx.8xlarge by Genesis Hosting Solutions",
"color": "#c16b28",
"data": [
{
"x": 1014.4779509330792,
"y": 12136.797013811545
},
{
"x": 1013.287524188552,
"y": 11157.05054470985
},
{
"x": 1012.4486626901419,
"y": 11407.162014100133
},
{
"x": 1011.7225061420855,
"y": 11373.405081291641
},
{
"x": 993.4217370457291,
"y": 12387.165295843111
},
{
"x": 1013.3005860868434,
"y": 11512.054480438706
},
{
"x": 996.6172327536458,
"y": 11926.663770511208
},
{
"x": 1023.1237243115406,
"y": 11374.639490920916
},
{
"x": 991.2481020224116,
"y": 12329.320138619907
},
{
"x": 1008.54442779896,
"y": 11525.713486079843
},
{
"x": 1013.9363268034504,
"y": 11490.74662770025
},
{
"x": 993.8069905127677,
"y": 12111.562515614327
},
{
"x": 1008.1435668556071,
"y": 12051.328112261861
},
{
"x": 1020.7135827485797,
"y": 11503.63565432448
},
{
"x": 1017.6338439755925,
"y": 12081.03242190444
},
{
"x": 1015.2114576778815,
"y": 11252.224254983692
},
{
"x": 1003.0126839858494,
"y": 12102.895457875122
},
{
"x": 1015.925135419493,
"y": 11228.596533505864
},
{
"x": 1001.6389821891726,
"y": 12131.029356529205
},
{
"x": 1021.2364246707111,
"y": 11348.73916042918
},
{
"x": 1041.9859582321515,
"y": 10057.666844709525
},
{
"x": 1039.6031089514838,
"y": 10246.903982618704
},
{
"x": 1009.3291740723332,
"y": 10833.620913305853
},
{
"x": 1009.0196268613556,
"y": 11409.48730471754
},
{
"x": 1016.618603004342,
"y": 10947.865984735497
},
{
"x": 1018.9065211044865,
"y": 10735.623011110789
},
{
"x": 1022.0331912251512,
"y": 10665.783393711637
},
{
"x": 1011.1418077597734,
"y": 11195.380861908572
},
{
"x": 1019.6892738732578,
"y": 11115.209524186714
},
{
"x": 1024.376208583287,
"y": 10827.743444060732
},
{
"x": 1016.5089072274557,
"y": 11199.488859930665
},
{
"x": 1017.9463737780363,
"y": 11112.921194679671
},
{
"x": 1010.2831587730227,
"y": 10538.989092335965
},
{
"x": 1009.6200346088992,
"y": 10810.983593296416
},
{
"x": 1015.8018015440966,
"y": 10811.878916671476
},
{
"x": 1024.2827576758577,
"y": 10286.281328140121
},
{
"x": 1016.4851734671338,
"y": 10406.087044648302
},
{
"x": 1007.9036771129521,
"y": 10425.680281262463
},
{
"x": 1018.6286541900472,
"y": 10598.524596196236
},
{
"x": 1020.6673213343357,
"y": 10839.520383392624
}
]
}
],
"drilldown": {},
"tooltip": {
"enabled": true,
"useHTML": false,
"format": null,
"headerFormat": "",
"pointFormat": "<span style=\"color:{series.color}\">Single</span>: <b>{point.x:.0f}</b><br><span style=\"color:{series.color}\">Multi</span>: <b>{point.y:.0f}</b>",
"footerFormat": "",
"shared": false,
"outside": false,
"valueDecimals": null,
"split": false
},
"annotations": null
},
"hc_type": "chart",
"id": "75254556076600879069488863786906911176"
}
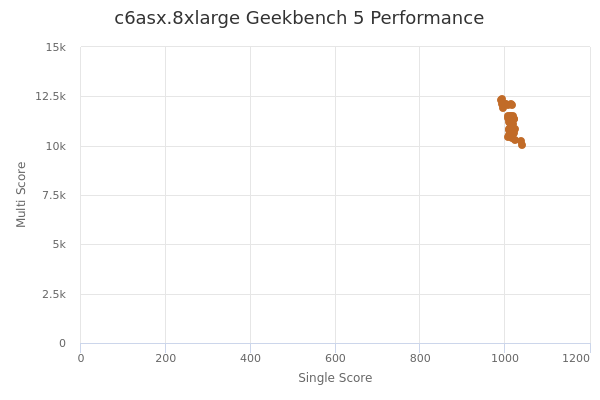
| Single | Multi | |
|---|---|---|
| Max | 1042 | 12387 |
| Average | 1014 | 11237 |
| Deviation | 10.25 | 611.64 |
| Min | 991 | 10058 |
Sign up as Freemium to get more insight.