eo2a.3xlarge by CloudFerro
Geekbench is a cross-platform processor benchmark with a scoring system that determines single-core and multi-core performance using loads simulating real-world scenarios. Geekbench 5 score is calculated with a reference score of 2500 representing the performance of the Intel Core i5-2520M @ 2.50 GHz. The software benchmark is available for Mac OS, Windows, Linux, Android and iOS platforms.
Specifications:
CPU
16
RAM
64.0 GB
Root
256 GB
eo2a.3xlarge Root SSD
{
"configuration": {
"chart": {
"type": "scatter",
"polar": false,
"zoomType": "",
"options3d": {},
"height": null,
"width": null,
"margin": null,
"inverted": false,
"zooming": {}
},
"credits": {
"enabled": false
},
"title": {
"text": ""
},
"colorAxis": null,
"subtitle": {
"text": ""
},
"xAxis": {
"title": {
"text": [
"Single Score"
],
"useHTML": false,
"style": {
"color": "#666666"
}
},
"categories": null,
"lineWidth": 1,
"tickInterval": null,
"tickWidth": 1,
"tickLength": 10,
"tickPixelInterval": 100,
"plotLines": null,
"labels": {
"enabled": true,
"format": null,
"formatter": "",
"style": {
"color": "#666666",
"cursor": "default",
"fontSize": "11px"
},
"useHTML": false,
"step": 0
},
"plotBands": null,
"visible": true,
"floor": null,
"ceiling": null,
"type": "linear",
"min": 0,
"gridLineWidth": 1,
"gridLineColor": "#e6e6e6",
"minorTickInterval": null,
"minorTickWidth": 0,
"minTickInterval": null,
"startOnTick": true,
"endOnTick": true,
"tickmarkPlacement": 100,
"units": 100,
"minRange": 100
},
"yAxis": {
"title": {
"text": [
"Multi Score"
],
"useHTML": false,
"style": {
"color": "#666666"
}
},
"categories": null,
"plotLines": null,
"plotBands": null,
"lineWidth": null,
"tickInterval": null,
"tickLength": 10,
"floor": null,
"ceiling": null,
"gridLineInterpolation": null,
"gridLineWidth": 1,
"gridLineColor": "#e6e6e6",
"min": 0,
"max": null,
"minorTickInterval": null,
"minorTickWidth": 0,
"minTickInterval": null,
"startOnTick": true,
"endOnTick": true,
"minRange": null,
"type": "linear",
"tickmarkPlacement": null,
"labels": {
"enabled": true,
"formatter": null,
"style": {
"color": "#666666",
"cursor": "default",
"fontSize": "11px"
},
"useHTML": false
}
},
"zAxis": {
"title": {
"text": "Multi Score"
}
},
"plotOptions": {
"series": {
"dataLabels": {
"enabled": false,
"format": null,
"distance": 30,
"align": "center",
"inside": null,
"allowOverlap": false,
"style": {
"fontSize": "11px"
}
},
"showInLegend": null,
"turboThreshold": 0,
"stacking": "",
"groupPadding": 0.2,
"centerInCategory": false,
"findNearestPointBy": "x"
}
},
"navigator": {
"enabled": false
},
"scrollbar": {
"enabled": false
},
"rangeSelector": {
"enabled": false,
"inputEnabled": false
},
"legend": {
"enabled": null,
"maxHeight": null,
"align": "center",
"verticalAlign": "bottom",
"layout": "horizontal",
"width": null,
"margin": 12,
"reversed": false
},
"series": [
{
"name": "eo2a.3xlarge by CloudFerro",
"color": "#FF8225",
"data": [
{
"x": 991.9159701018373,
"y": 11757.777490355349
},
{
"x": 965.1433519200664,
"y": 11645.601903917996
},
{
"x": 992.7133123656024,
"y": 11698.437127370122
},
{
"x": 972.4968757266457,
"y": 11672.684300713567
},
{
"x": 998.8991678928733,
"y": 11791.795517410555
},
{
"x": 975.7563180549455,
"y": 11674.50692140733
},
{
"x": 990.018662346549,
"y": 11780.119835737985
},
{
"x": 968.0872552845152,
"y": 11579.413685330022
},
{
"x": 990.5830804909192,
"y": 11676.682152880283
},
{
"x": 968.7781046069254,
"y": 11614.039074436147
},
{
"x": 993.0677210866427,
"y": 11559.83318223817
},
{
"x": 978.264294072216,
"y": 11201.307073322743
},
{
"x": 999.5033094563441,
"y": 11547.16182763431
},
{
"x": 988.5075595178889,
"y": 11492.274678319061
},
{
"x": 1000.0920679167177,
"y": 11830.315170225118
},
{
"x": 965.9485717263437,
"y": 11617.410774603333
},
{
"x": 1000.0536624252136,
"y": 11585.01350550653
},
{
"x": 969.505670923307,
"y": 11532.81952327935
},
{
"x": 990.6297568556624,
"y": 11678.597131563087
},
{
"x": 968.5110238105074,
"y": 11431.390477557134
}
]
}
],
"drilldown": {},
"tooltip": {
"enabled": true,
"useHTML": false,
"format": null,
"headerFormat": "",
"pointFormat": "<span style=\"color:{series.color}\">Single</span>: <b>{point.x:.0f}</b><br><span style=\"color:{series.color}\">Multi</span>: <b>{point.y:.0f}</b>",
"footerFormat": "",
"shared": false,
"outside": false,
"valueDecimals": null,
"split": false
},
"annotations": null
},
"hc_type": "chart",
"id": "7716252557840221467654810834087774996"
}
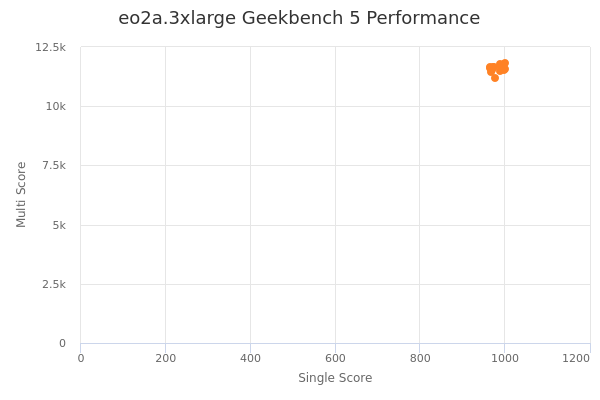
| Single | Multi | |
|---|---|---|
| Max | 1000 | 11830 |
| Average | 983 | 11618 |
| Deviation | 12.62 | 138.59 |
| Min | 965 | 11201 |
Sign up as Freemium to get more insight.
- In same series
- eo2a.medium
- eo2a.large
- eo2a.xlarge
- eo2a.2xlarge
- eo2a.3xlarge
- eo2a.4xlarge
- eo2a.5xlarge