eo2a.2xlarge by CloudFerro
Geekbench is a cross-platform processor benchmark with a scoring system that determines single-core and multi-core performance using loads simulating real-world scenarios. Geekbench 5 score is calculated with a reference score of 2500 representing the performance of the Intel Core i5-2520M @ 2.50 GHz. The software benchmark is available for Mac OS, Windows, Linux, Android and iOS platforms.
Specifications:
CPU
8
RAM
32.0 GB
Root
128 GB
eo2a.2xlarge Root SSD
{
"configuration": {
"chart": {
"type": "scatter",
"polar": false,
"zoomType": "",
"options3d": {},
"height": null,
"width": null,
"margin": null,
"inverted": false,
"zooming": {}
},
"credits": {
"enabled": false
},
"title": {
"text": ""
},
"colorAxis": null,
"subtitle": {
"text": ""
},
"xAxis": {
"title": {
"text": [
"Single Score"
],
"useHTML": false,
"style": {
"color": "#666666"
}
},
"categories": null,
"lineWidth": 1,
"tickInterval": null,
"tickWidth": 1,
"tickLength": 10,
"tickPixelInterval": 100,
"plotLines": null,
"labels": {
"enabled": true,
"format": null,
"formatter": "",
"style": {
"color": "#666666",
"cursor": "default",
"fontSize": "11px"
},
"useHTML": false,
"step": 0
},
"plotBands": null,
"visible": true,
"floor": null,
"ceiling": null,
"type": "linear",
"min": 0,
"gridLineWidth": 1,
"gridLineColor": "#e6e6e6",
"minorTickInterval": null,
"minorTickWidth": 0,
"minTickInterval": null,
"startOnTick": true,
"endOnTick": true,
"tickmarkPlacement": 100,
"units": 100,
"minRange": 100
},
"yAxis": {
"title": {
"text": [
"Multi Score"
],
"useHTML": false,
"style": {
"color": "#666666"
}
},
"categories": null,
"plotLines": null,
"plotBands": null,
"lineWidth": null,
"tickInterval": null,
"tickLength": 10,
"floor": null,
"ceiling": null,
"gridLineInterpolation": null,
"gridLineWidth": 1,
"gridLineColor": "#e6e6e6",
"min": 0,
"max": null,
"minorTickInterval": null,
"minorTickWidth": 0,
"minTickInterval": null,
"startOnTick": true,
"endOnTick": true,
"minRange": null,
"type": "linear",
"tickmarkPlacement": null,
"labels": {
"enabled": true,
"formatter": null,
"style": {
"color": "#666666",
"cursor": "default",
"fontSize": "11px"
},
"useHTML": false
}
},
"zAxis": {
"title": {
"text": "Multi Score"
}
},
"plotOptions": {
"series": {
"dataLabels": {
"enabled": false,
"format": null,
"distance": 30,
"align": "center",
"inside": null,
"allowOverlap": false,
"style": {
"fontSize": "11px"
}
},
"showInLegend": null,
"turboThreshold": 0,
"stacking": "",
"groupPadding": 0.2,
"centerInCategory": false,
"findNearestPointBy": "x"
}
},
"navigator": {
"enabled": false
},
"scrollbar": {
"enabled": false
},
"rangeSelector": {
"enabled": false,
"inputEnabled": false
},
"legend": {
"enabled": null,
"maxHeight": null,
"align": "center",
"verticalAlign": "bottom",
"layout": "horizontal",
"width": null,
"margin": 12,
"reversed": false
},
"series": [
{
"name": "eo2a.2xlarge by CloudFerro",
"color": "#FF8225",
"data": [
{
"x": 1046.3483860207386,
"y": 7662.930433930282
},
{
"x": 1035.2093836347192,
"y": 7265.656155881772
},
{
"x": 1030.3926632978892,
"y": 7390.987448722495
},
{
"x": 1041.6699790750588,
"y": 7222.076088646599
},
{
"x": 1049.674167945117,
"y": 7670.88158283168
},
{
"x": 1037.4992026026282,
"y": 7459.922109901568
},
{
"x": 1041.7299376164337,
"y": 7773.067905753851
},
{
"x": 1049.19284629188,
"y": 7043.605268698675
},
{
"x": 1045.6590574696327,
"y": 7692.80668263374
},
{
"x": 1032.355676479749,
"y": 7240.221105364754
},
{
"x": 1041.5736766411735,
"y": 7636.702466528826
},
{
"x": 1029.3429240246232,
"y": 7423.045748129072
},
{
"x": 1055.8221619783017,
"y": 7303.902351615359
},
{
"x": 1034.2534265328768,
"y": 7075.910673086264
},
{
"x": 1032.2157943260204,
"y": 7480.925248251764
},
{
"x": 1041.1889991328987,
"y": 7067.026412625263
},
{
"x": 1053.5250752516815,
"y": 6368.278395604578
},
{
"x": 1021.2704986685555,
"y": 6523.7830803000215
},
{
"x": 1055.2851173830275,
"y": 7577.953220416419
},
{
"x": 1008.3398422058699,
"y": 6609.433558057786
}
]
}
],
"drilldown": {},
"tooltip": {
"enabled": true,
"useHTML": false,
"format": null,
"headerFormat": "",
"pointFormat": "<span style=\"color:{series.color}\">Single</span>: <b>{point.x:.0f}</b><br><span style=\"color:{series.color}\">Multi</span>: <b>{point.y:.0f}</b>",
"footerFormat": "",
"shared": false,
"outside": false,
"valueDecimals": null,
"split": false
},
"annotations": null
},
"hc_type": "chart",
"id": "122873197061889996449677513719036624756"
}
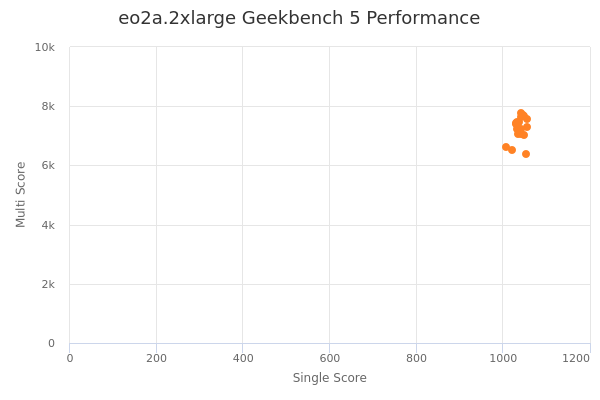
| Single | Multi | |
|---|---|---|
| Max | 1056 | 7773 |
| Average | 1039 | 7274 |
| Deviation | 11.52 | 389.57 |
| Min | 1008 | 6368 |
Sign up as Freemium to get more insight.
- In same series
- eo2a.medium
- eo2a.large
- eo2a.xlarge
- eo2a.2xlarge
- eo2a.3xlarge
- eo2a.4xlarge
- eo2a.5xlarge