Standard_D8_v4 by Microsoft Azure
Geekbench is a cross-platform processor benchmark with a scoring system that determines single-core and multi-core performance using loads simulating real-world scenarios. Geekbench 5 score is calculated with a reference score of 2500 representing the performance of the Intel Core i5-2520M @ 2.50 GHz. The software benchmark is available for Mac OS, Windows, Linux, Android and iOS platforms.
Specifications:
CPU
8
RAM
32.0 GB
Net
4000 Mbps
{
"configuration": {
"chart": {
"type": "scatter",
"polar": false,
"zoomType": "",
"options3d": {},
"height": null,
"width": null,
"margin": null,
"inverted": false,
"zooming": {}
},
"credits": {
"enabled": false
},
"title": {
"text": ""
},
"colorAxis": null,
"subtitle": {
"text": ""
},
"xAxis": {
"title": {
"text": [
"Single Score"
],
"useHTML": false,
"style": {
"color": "#666666"
}
},
"categories": null,
"lineWidth": 1,
"tickInterval": null,
"tickWidth": 1,
"tickLength": 10,
"tickPixelInterval": 100,
"plotLines": null,
"labels": {
"enabled": true,
"format": null,
"formatter": "",
"style": {
"color": "#666666",
"cursor": "default",
"fontSize": "11px"
},
"useHTML": false,
"step": 0
},
"plotBands": null,
"visible": true,
"floor": null,
"ceiling": null,
"type": "linear",
"min": 0,
"gridLineWidth": 1,
"gridLineColor": "#e6e6e6",
"minorTickInterval": null,
"minorTickWidth": 0,
"minTickInterval": null,
"startOnTick": true,
"endOnTick": true,
"tickmarkPlacement": 100,
"units": 100,
"minRange": 100
},
"yAxis": {
"title": {
"text": [
"Multi Score"
],
"useHTML": false,
"style": {
"color": "#666666"
}
},
"categories": null,
"plotLines": null,
"plotBands": null,
"lineWidth": null,
"tickInterval": null,
"tickLength": 10,
"floor": null,
"ceiling": null,
"gridLineInterpolation": null,
"gridLineWidth": 1,
"gridLineColor": "#e6e6e6",
"min": 0,
"max": null,
"minorTickInterval": null,
"minorTickWidth": 0,
"minTickInterval": null,
"startOnTick": true,
"endOnTick": true,
"minRange": null,
"type": "linear",
"tickmarkPlacement": null,
"labels": {
"enabled": true,
"formatter": null,
"style": {
"color": "#666666",
"cursor": "default",
"fontSize": "11px"
},
"useHTML": false
}
},
"zAxis": {
"title": {
"text": "Multi Score"
}
},
"plotOptions": {
"series": {
"dataLabels": {
"enabled": false,
"format": null,
"distance": 30,
"align": "center",
"inside": null,
"allowOverlap": false,
"style": {
"fontSize": "11px"
}
},
"showInLegend": null,
"turboThreshold": 0,
"stacking": "",
"groupPadding": 0.2,
"centerInCategory": false,
"findNearestPointBy": "x"
}
},
"navigator": {
"enabled": false
},
"scrollbar": {
"enabled": false
},
"rangeSelector": {
"enabled": false,
"inputEnabled": false
},
"legend": {
"enabled": null,
"maxHeight": null,
"align": "center",
"verticalAlign": "bottom",
"layout": "horizontal",
"width": null,
"margin": 12,
"reversed": false
},
"series": [
{
"name": "Standard_D8_v4 by Microsoft Azure",
"color": "#55b3ff",
"data": [
{
"x": 979.4945709466003,
"y": 4398.791087791685
},
{
"x": 945.7809334961062,
"y": 4164.594422055441
},
{
"x": 977.6505978867522,
"y": 4407.839779303106
},
{
"x": 899.0164325682742,
"y": 4141.707136938998
},
{
"x": 981.5912001308252,
"y": 4414.803749179763
},
{
"x": 924.2171324648413,
"y": 4153.430039644383
},
{
"x": 980.0997197568887,
"y": 4405.709703658412
},
{
"x": 905.6542679901834,
"y": 4182.43462286516
},
{
"x": 979.0140745746091,
"y": 4413.3730645634805
},
{
"x": 926.8432357332663,
"y": 4209.998572983868
},
{
"x": 980.3634874137083,
"y": 4409.416765761958
},
{
"x": 943.0816966799425,
"y": 4204.157509924266
},
{
"x": 982.1141671941866,
"y": 4404.802920535878
},
{
"x": 922.3291453122658,
"y": 4194.038242128241
},
{
"x": 970.3866834033602,
"y": 4406.8234651391795
},
{
"x": 926.620584259352,
"y": 4189.219689499037
},
{
"x": 976.835083536763,
"y": 4404.056270884309
},
{
"x": 915.286202956158,
"y": 4222.6313162262095
},
{
"x": 967.62481781173,
"y": 4389.692906365389
},
{
"x": 919.7836860585644,
"y": 4198.18113824973
},
{
"x": 908.6624693231901,
"y": 4202.0124970828965
},
{
"x": 936.6154618138281,
"y": 4132.225061839594
},
{
"x": 906.515571965379,
"y": 4199.14658473848
},
{
"x": 930.4541885303594,
"y": 4148.330908264185
},
{
"x": 911.4809212924885,
"y": 4178.611229764573
},
{
"x": 932.4784838318615,
"y": 4134.739081199261
},
{
"x": 923.1073898859697,
"y": 4117.61180301751
},
{
"x": 903.5574316974853,
"y": 4125.856320388244
},
{
"x": 929.3704298510604,
"y": 4123.194355580881
},
{
"x": 905.0396777119956,
"y": 4147.921381447274
}
]
}
],
"drilldown": {},
"tooltip": {
"enabled": true,
"useHTML": false,
"format": null,
"headerFormat": "",
"pointFormat": "<span style=\"color:{series.color}\">Single</span>: <b>{point.x:.0f}</b><br><span style=\"color:{series.color}\">Multi</span>: <b>{point.y:.0f}</b>",
"footerFormat": "",
"shared": false,
"outside": false,
"valueDecimals": null,
"split": false
},
"annotations": null
},
"hc_type": "chart",
"id": "318278401076805906751943277690818508068"
}
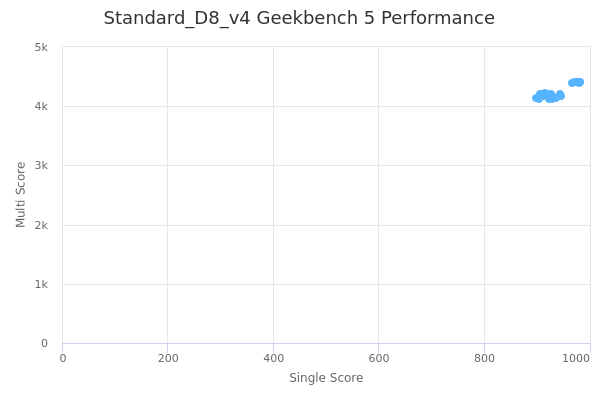
| Single | Multi | |
|---|---|---|
| Max | 982 | 4415 |
| Average | 940 | 4248 |
| Deviation | 28.95 | 114.89 |
| Min | 899 | 4118 |
Sign up as Freemium to get more insight.