Standard_D4_v4 by Microsoft Azure
Geekbench is a cross-platform processor benchmark with a scoring system that determines single-core and multi-core performance using loads simulating real-world scenarios. Geekbench 5 score is calculated with a reference score of 2500 representing the performance of the Intel Core i5-2520M @ 2.50 GHz. The software benchmark is available for Mac OS, Windows, Linux, Android and iOS platforms.
Specifications:
CPU
4
RAM
16.0 GB
Net
2000 Mbps
{
"configuration": {
"chart": {
"type": "scatter",
"polar": false,
"zoomType": "",
"options3d": {},
"height": null,
"width": null,
"margin": null,
"inverted": false,
"zooming": {}
},
"credits": {
"enabled": false
},
"title": {
"text": ""
},
"colorAxis": null,
"subtitle": {
"text": ""
},
"xAxis": {
"title": {
"text": [
"Single Score"
],
"useHTML": false,
"style": {
"color": "#666666"
}
},
"categories": null,
"lineWidth": 1,
"tickInterval": null,
"tickWidth": 1,
"tickLength": 10,
"tickPixelInterval": 100,
"plotLines": null,
"labels": {
"enabled": true,
"format": null,
"formatter": "",
"style": {
"color": "#666666",
"cursor": "default",
"fontSize": "11px"
},
"useHTML": false,
"step": 0
},
"plotBands": null,
"visible": true,
"floor": null,
"ceiling": null,
"type": "linear",
"min": 0,
"gridLineWidth": 1,
"gridLineColor": "#e6e6e6",
"minorTickInterval": null,
"minorTickWidth": 0,
"minTickInterval": null,
"startOnTick": true,
"endOnTick": true,
"tickmarkPlacement": 100,
"units": 100,
"minRange": 100
},
"yAxis": {
"title": {
"text": [
"Multi Score"
],
"useHTML": false,
"style": {
"color": "#666666"
}
},
"categories": null,
"plotLines": null,
"plotBands": null,
"lineWidth": null,
"tickInterval": null,
"tickLength": 10,
"floor": null,
"ceiling": null,
"gridLineInterpolation": null,
"gridLineWidth": 1,
"gridLineColor": "#e6e6e6",
"min": 0,
"max": null,
"minorTickInterval": null,
"minorTickWidth": 0,
"minTickInterval": null,
"startOnTick": true,
"endOnTick": true,
"minRange": null,
"type": "linear",
"tickmarkPlacement": null,
"labels": {
"enabled": true,
"formatter": null,
"style": {
"color": "#666666",
"cursor": "default",
"fontSize": "11px"
},
"useHTML": false
}
},
"zAxis": {
"title": {
"text": "Multi Score"
}
},
"plotOptions": {
"series": {
"dataLabels": {
"enabled": false,
"format": null,
"distance": 30,
"align": "center",
"inside": null,
"allowOverlap": false,
"style": {
"fontSize": "11px"
}
},
"showInLegend": null,
"turboThreshold": 0,
"stacking": "",
"groupPadding": 0.2,
"centerInCategory": false,
"findNearestPointBy": "x"
}
},
"navigator": {
"enabled": false
},
"scrollbar": {
"enabled": false
},
"rangeSelector": {
"enabled": false,
"inputEnabled": false
},
"legend": {
"enabled": null,
"maxHeight": null,
"align": "center",
"verticalAlign": "bottom",
"layout": "horizontal",
"width": null,
"margin": 12,
"reversed": false
},
"series": [
{
"name": "Standard_D4_v4 by Microsoft Azure",
"color": "#55b3ff",
"data": [
{
"x": 967.853371612058,
"y": 2258.7643048875548
},
{
"x": 934.5532715332747,
"y": 2189.798464293011
},
{
"x": 974.8480932119351,
"y": 2273.5950700088692
},
{
"x": 930.7695627780412,
"y": 2175.2396602474714
},
{
"x": 954.7999945167905,
"y": 2237.694725341358
},
{
"x": 930.0636673414701,
"y": 2198.8228806692523
},
{
"x": 966.7411973662912,
"y": 2253.2515266844803
},
{
"x": 924.7126909117154,
"y": 2196.218861812382
},
{
"x": 947.8130349416103,
"y": 2242.3113832552963
},
{
"x": 932.2898172828242,
"y": 2189.0644141291896
},
{
"x": 945.9829457504197,
"y": 2248.7277787043413
},
{
"x": 926.5725358421007,
"y": 2192.5113170742347
},
{
"x": 959.875284550647,
"y": 2237.0584564307555
},
{
"x": 930.8356458010169,
"y": 2207.5618912484374
},
{
"x": 948.1475719013529,
"y": 2263.390164180519
},
{
"x": 918.3841422414357,
"y": 2209.3920992287312
},
{
"x": 967.4589596348933,
"y": 2270.9416153901448
},
{
"x": 928.3741056273245,
"y": 2200.3635312194156
},
{
"x": 961.0210419989046,
"y": 2274.276824538294
},
{
"x": 926.5663725897509,
"y": 2188.6084795686747
}
]
}
],
"drilldown": {},
"tooltip": {
"enabled": true,
"useHTML": false,
"format": null,
"headerFormat": "",
"pointFormat": "<span style=\"color:{series.color}\">Single</span>: <b>{point.x:.0f}</b><br><span style=\"color:{series.color}\">Multi</span>: <b>{point.y:.0f}</b>",
"footerFormat": "",
"shared": false,
"outside": false,
"valueDecimals": null,
"split": false
},
"annotations": null
},
"hc_type": "chart",
"id": "146701238154196135864062968793597346836"
}
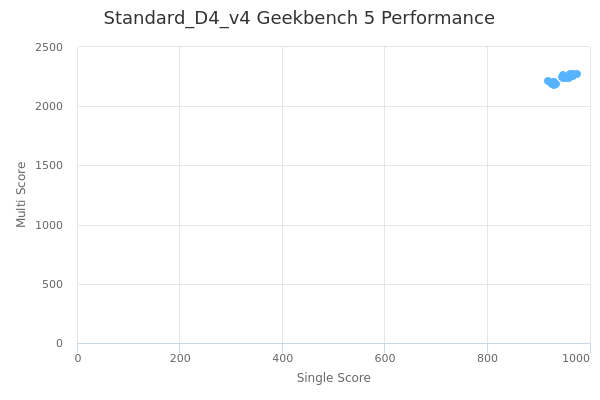
| Single | Multi | |
|---|---|---|
| Max | 975 | 2274 |
| Average | 944 | 2225 |
| Deviation | 17.22 | 32.81 |
| Min | 918 | 2175 |
Sign up as Freemium to get more insight.