Standard_D2_v4 by Microsoft Azure
Geekbench is a cross-platform processor benchmark with a scoring system that determines single-core and multi-core performance using loads simulating real-world scenarios. Geekbench 5 score is calculated with a reference score of 2500 representing the performance of the Intel Core i5-2520M @ 2.50 GHz. The software benchmark is available for Mac OS, Windows, Linux, Android and iOS platforms.
Specifications:
CPU
2
RAM
8.0 GB
Net
1000 Mbps
{
"configuration": {
"chart": {
"type": "scatter",
"polar": false,
"zoomType": "",
"options3d": {},
"height": null,
"width": null,
"margin": null,
"inverted": false,
"zooming": {}
},
"credits": {
"enabled": false
},
"title": {
"text": ""
},
"colorAxis": null,
"subtitle": {
"text": ""
},
"xAxis": {
"title": {
"text": [
"Single Score"
],
"useHTML": false,
"style": {
"color": "#666666"
}
},
"categories": null,
"lineWidth": 1,
"tickInterval": null,
"tickWidth": 1,
"tickLength": 10,
"tickPixelInterval": 100,
"plotLines": null,
"labels": {
"enabled": true,
"format": null,
"formatter": "",
"style": {
"color": "#666666",
"cursor": "default",
"fontSize": "11px"
},
"useHTML": false,
"step": 0
},
"plotBands": null,
"visible": true,
"floor": null,
"ceiling": null,
"type": "linear",
"min": 0,
"gridLineWidth": 1,
"gridLineColor": "#e6e6e6",
"minorTickInterval": null,
"minorTickWidth": 0,
"minTickInterval": null,
"startOnTick": true,
"endOnTick": true,
"tickmarkPlacement": 100,
"units": 100,
"minRange": 100
},
"yAxis": {
"title": {
"text": [
"Multi Score"
],
"useHTML": false,
"style": {
"color": "#666666"
}
},
"categories": null,
"plotLines": null,
"plotBands": null,
"lineWidth": null,
"tickInterval": null,
"tickLength": 10,
"floor": null,
"ceiling": null,
"gridLineInterpolation": null,
"gridLineWidth": 1,
"gridLineColor": "#e6e6e6",
"min": 0,
"max": null,
"minorTickInterval": null,
"minorTickWidth": 0,
"minTickInterval": null,
"startOnTick": true,
"endOnTick": true,
"minRange": null,
"type": "linear",
"tickmarkPlacement": null,
"labels": {
"enabled": true,
"formatter": null,
"style": {
"color": "#666666",
"cursor": "default",
"fontSize": "11px"
},
"useHTML": false
}
},
"zAxis": {
"title": {
"text": "Multi Score"
}
},
"plotOptions": {
"series": {
"dataLabels": {
"enabled": false,
"format": null,
"distance": 30,
"align": "center",
"inside": null,
"allowOverlap": false,
"style": {
"fontSize": "11px"
}
},
"showInLegend": null,
"turboThreshold": 0,
"stacking": "",
"groupPadding": 0.2,
"centerInCategory": false,
"findNearestPointBy": "x"
}
},
"navigator": {
"enabled": false
},
"scrollbar": {
"enabled": false
},
"rangeSelector": {
"enabled": false,
"inputEnabled": false
},
"legend": {
"enabled": null,
"maxHeight": null,
"align": "center",
"verticalAlign": "bottom",
"layout": "horizontal",
"width": null,
"margin": 12,
"reversed": false
},
"series": [
{
"name": "Standard_D2_v4 by Microsoft Azure",
"color": "#55b3ff",
"data": [
{
"x": 943.7102673973957,
"y": 1129.89441453086
},
{
"x": 936.4378503905942,
"y": 1129.24337827011
},
{
"x": 947.8107884692434,
"y": 1121.1398912253987
},
{
"x": 936.1684543846095,
"y": 1130.9602280236309
},
{
"x": 941.7832809956143,
"y": 1130.9252326727365
},
{
"x": 938.9589136918619,
"y": 1130.4867105200537
},
{
"x": 942.8945871446093,
"y": 1129.851304663687
},
{
"x": 943.2599676382288,
"y": 1130.7217263638763
},
{
"x": 947.243133523973,
"y": 1131.243316545668
},
{
"x": 942.8189988637303,
"y": 1130.612417677818
},
{
"x": 933.2832213829722,
"y": 1133.4711167866305
},
{
"x": 941.474575220635,
"y": 1128.981058236489
},
{
"x": 948.7146710564112,
"y": 1136.276627883109
},
{
"x": 938.8674754121971,
"y": 1131.268725341348
},
{
"x": 949.3271595850492,
"y": 1133.0416588567211
},
{
"x": 937.9505024732888,
"y": 1129.1556613179819
},
{
"x": 941.1203217927707,
"y": 1134.794599609842
},
{
"x": 932.9462974103195,
"y": 1125.0033254923771
},
{
"x": 936.8077432545224,
"y": 1125.987450194416
},
{
"x": 935.2519452937365,
"y": 1122.2985830500747
}
]
}
],
"drilldown": {},
"tooltip": {
"enabled": true,
"useHTML": false,
"format": null,
"headerFormat": "",
"pointFormat": "<span style=\"color:{series.color}\">Single</span>: <b>{point.x:.0f}</b><br><span style=\"color:{series.color}\">Multi</span>: <b>{point.y:.0f}</b>",
"footerFormat": "",
"shared": false,
"outside": false,
"valueDecimals": null,
"split": false
},
"annotations": null
},
"hc_type": "chart",
"id": "252674137860333205951511842930387153610"
}
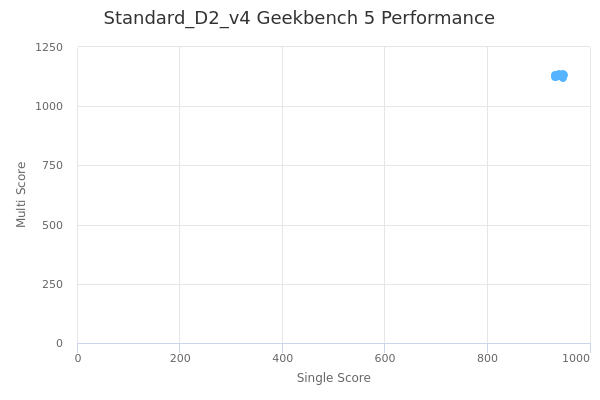
| Single | Multi | |
|---|---|---|
| Max | 949 | 1136 |
| Average | 941 | 1130 |
| Deviation | 4.85 | 3.67 |
| Min | 933 | 1121 |
Sign up as Freemium to get more insight.