x2iezn.2xlarge by Amazon Web Services
Geekbench is a cross-platform processor benchmark with a scoring system that determines single-core and multi-core performance using loads simulating real-world scenarios. Geekbench 5 score is calculated with a reference score of 2500 representing the performance of the Intel Core i5-2520M @ 2.50 GHz. The software benchmark is available for Mac OS, Windows, Linux, Android and iOS platforms.
Specifications:
CPU
8
RAM
256.0 GB
Net
25000 Mbps
{
"configuration": {
"chart": {
"type": "scatter",
"polar": false,
"zoomType": "",
"options3d": {},
"height": null,
"width": null,
"margin": null,
"inverted": false,
"zooming": {}
},
"credits": {
"enabled": false
},
"title": {
"text": ""
},
"colorAxis": null,
"subtitle": {
"text": ""
},
"xAxis": {
"title": {
"text": [
"Single Score"
],
"useHTML": false,
"style": {
"color": "#666666"
}
},
"categories": null,
"lineWidth": 1,
"tickInterval": null,
"tickWidth": 1,
"tickLength": 10,
"tickPixelInterval": 100,
"plotLines": null,
"labels": {
"enabled": true,
"format": null,
"formatter": "",
"style": {
"color": "#666666",
"cursor": "default",
"fontSize": "11px"
},
"useHTML": false,
"step": 0
},
"plotBands": null,
"visible": true,
"floor": null,
"ceiling": null,
"type": "linear",
"min": 0,
"gridLineWidth": 1,
"gridLineColor": "#e6e6e6",
"minorTickInterval": null,
"minorTickWidth": 0,
"minTickInterval": null,
"startOnTick": true,
"endOnTick": true,
"tickmarkPlacement": 100,
"units": 100,
"minRange": 100
},
"yAxis": {
"title": {
"text": [
"Multi Score"
],
"useHTML": false,
"style": {
"color": "#666666"
}
},
"categories": null,
"plotLines": null,
"plotBands": null,
"lineWidth": null,
"tickInterval": null,
"tickLength": 10,
"floor": null,
"ceiling": null,
"gridLineInterpolation": null,
"gridLineWidth": 1,
"gridLineColor": "#e6e6e6",
"min": 0,
"max": null,
"minorTickInterval": null,
"minorTickWidth": 0,
"minTickInterval": null,
"startOnTick": true,
"endOnTick": true,
"minRange": null,
"type": "linear",
"tickmarkPlacement": null,
"labels": {
"enabled": true,
"formatter": null,
"style": {
"color": "#666666",
"cursor": "default",
"fontSize": "11px"
},
"useHTML": false
}
},
"zAxis": {
"title": {
"text": "Multi Score"
}
},
"plotOptions": {
"series": {
"dataLabels": {
"enabled": false,
"format": null,
"distance": 30,
"align": "center",
"inside": null,
"allowOverlap": false,
"style": {
"fontSize": "11px"
}
},
"showInLegend": null,
"turboThreshold": 0,
"stacking": "",
"groupPadding": 0.2,
"centerInCategory": false,
"findNearestPointBy": "x"
}
},
"navigator": {
"enabled": false
},
"scrollbar": {
"enabled": false
},
"rangeSelector": {
"enabled": false,
"inputEnabled": false
},
"legend": {
"enabled": null,
"maxHeight": null,
"align": "center",
"verticalAlign": "bottom",
"layout": "horizontal",
"width": null,
"margin": 12,
"reversed": false
},
"series": [
{
"name": "x2iezn.2xlarge by Amazon Web Services",
"color": "#f7981d",
"data": [
{
"x": 1221.7263731120884,
"y": 5430.928858463344
},
{
"x": 1215.3174085597918,
"y": 5447.664584231867
},
{
"x": 1220.1399612149582,
"y": 5468.148021753751
},
{
"x": 1207.8287965898398,
"y": 5421.88804145522
},
{
"x": 1218.8449635626707,
"y": 5463.4743287265155
},
{
"x": 1216.6742591323862,
"y": 5418.6400732846805
},
{
"x": 1218.6357832997537,
"y": 5463.351566102079
},
{
"x": 1208.7887908816258,
"y": 5460.85282608919
},
{
"x": 1221.5828746310526,
"y": 5471.922657957876
},
{
"x": 1210.7226577751103,
"y": 5427.657774133966
},
{
"x": 1223.2389767776956,
"y": 5477.7787181652175
},
{
"x": 1211.0749155691062,
"y": 5422.760359512698
},
{
"x": 1220.827055516145,
"y": 5478.218353012249
},
{
"x": 1210.2291895058372,
"y": 5452.85376885335
},
{
"x": 1223.566244769289,
"y": 5437.046461737419
},
{
"x": 1209.98523313494,
"y": 5418.1486535402055
},
{
"x": 1220.1048260464886,
"y": 5463.468894709331
},
{
"x": 1212.2936049149944,
"y": 5454.780139922073
},
{
"x": 1219.633149853625,
"y": 5447.494873930696
},
{
"x": 1210.4633178501788,
"y": 5453.3787919173665
}
]
}
],
"drilldown": {},
"tooltip": {
"enabled": true,
"useHTML": false,
"format": null,
"headerFormat": "",
"pointFormat": "<span style=\"color:{series.color}\">Single</span>: <b>{point.x:.0f}</b><br><span style=\"color:{series.color}\">Multi</span>: <b>{point.y:.0f}</b>",
"footerFormat": "",
"shared": false,
"outside": false,
"valueDecimals": null,
"split": false
},
"annotations": null
},
"hc_type": "chart",
"id": "91539603347751565086699738415020856847"
}
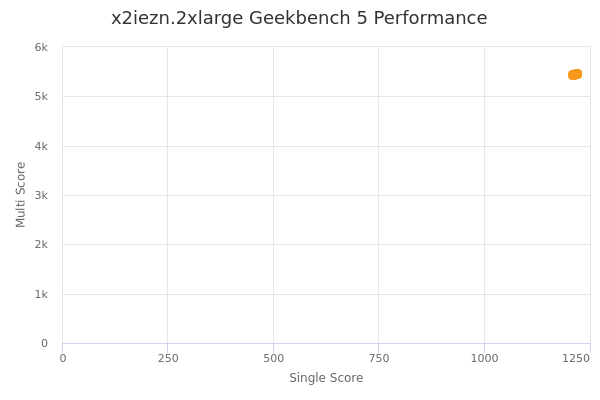
| Single | Multi | |
|---|---|---|
| Max | 1224 | 5478 |
| Average | 1216 | 5449 |
| Deviation | 5.22 | 19.54 |
| Min | 1208 | 5418 |
Sign up as Freemium to get more insight.