x2iezn.4xlarge by Amazon Web Services
Geekbench is a cross-platform processor benchmark with a scoring system that determines single-core and multi-core performance using loads simulating real-world scenarios. Geekbench 5 score is calculated with a reference score of 2500 representing the performance of the Intel Core i5-2520M @ 2.50 GHz. The software benchmark is available for Mac OS, Windows, Linux, Android and iOS platforms.
Specifications:
CPU
16
RAM
512.0 GB
Net
25000 Mbps
{
"configuration": {
"chart": {
"type": "scatter",
"polar": false,
"zoomType": "",
"options3d": {},
"height": null,
"width": null,
"margin": null,
"inverted": false,
"zooming": {}
},
"credits": {
"enabled": false
},
"title": {
"text": ""
},
"colorAxis": null,
"subtitle": {
"text": ""
},
"xAxis": {
"title": {
"text": [
"Single Score"
],
"useHTML": false,
"style": {
"color": "#666666"
}
},
"categories": null,
"lineWidth": 1,
"tickInterval": null,
"tickWidth": 1,
"tickLength": 10,
"tickPixelInterval": 100,
"plotLines": null,
"labels": {
"enabled": true,
"format": null,
"formatter": "",
"style": {
"color": "#666666",
"cursor": "default",
"fontSize": "11px"
},
"useHTML": false,
"step": 0
},
"plotBands": null,
"visible": true,
"floor": null,
"ceiling": null,
"type": "linear",
"min": 0,
"gridLineWidth": 1,
"gridLineColor": "#e6e6e6",
"minorTickInterval": null,
"minorTickWidth": 0,
"minTickInterval": null,
"startOnTick": true,
"endOnTick": true,
"tickmarkPlacement": 100,
"units": 100,
"minRange": 100
},
"yAxis": {
"title": {
"text": [
"Multi Score"
],
"useHTML": false,
"style": {
"color": "#666666"
}
},
"categories": null,
"plotLines": null,
"plotBands": null,
"lineWidth": null,
"tickInterval": null,
"tickLength": 10,
"floor": null,
"ceiling": null,
"gridLineInterpolation": null,
"gridLineWidth": 1,
"gridLineColor": "#e6e6e6",
"min": 0,
"max": null,
"minorTickInterval": null,
"minorTickWidth": 0,
"minTickInterval": null,
"startOnTick": true,
"endOnTick": true,
"minRange": null,
"type": "linear",
"tickmarkPlacement": null,
"labels": {
"enabled": true,
"formatter": null,
"style": {
"color": "#666666",
"cursor": "default",
"fontSize": "11px"
},
"useHTML": false
}
},
"zAxis": {
"title": {
"text": "Multi Score"
}
},
"plotOptions": {
"series": {
"dataLabels": {
"enabled": false,
"format": null,
"distance": 30,
"align": "center",
"inside": null,
"allowOverlap": false,
"style": {
"fontSize": "11px"
}
},
"showInLegend": null,
"turboThreshold": 0,
"stacking": "",
"groupPadding": 0.2,
"centerInCategory": false,
"findNearestPointBy": "x"
}
},
"navigator": {
"enabled": false
},
"scrollbar": {
"enabled": false
},
"rangeSelector": {
"enabled": false,
"inputEnabled": false
},
"legend": {
"enabled": null,
"maxHeight": null,
"align": "center",
"verticalAlign": "bottom",
"layout": "horizontal",
"width": null,
"margin": 12,
"reversed": false
},
"series": [
{
"name": "x2iezn.4xlarge by Amazon Web Services",
"color": "#f7981d",
"data": [
{
"x": 1219.9547752510716,
"y": 10321.888920650215
},
{
"x": 1226.1101642311887,
"y": 10346.411578289139
},
{
"x": 1222.0356721261987,
"y": 10314.974305224909
},
{
"x": 1226.3631713189475,
"y": 10372.17038812517
},
{
"x": 1218.8535880040179,
"y": 10314.307220924486
},
{
"x": 1220.5374251921592,
"y": 10329.727318424902
},
{
"x": 1221.7592168667468,
"y": 10345.592779425046
},
{
"x": 1225.5388850020613,
"y": 10378.049224434491
},
{
"x": 1222.786823067714,
"y": 10368.177554527267
},
{
"x": 1223.5488815736262,
"y": 10375.135953657666
},
{
"x": 1217.2933851375838,
"y": 10328.035178438005
},
{
"x": 1222.9321850588092,
"y": 10333.176549664648
},
{
"x": 1225.0929391339778,
"y": 10388.497538185953
},
{
"x": 1215.9823148473306,
"y": 10355.49871642847
},
{
"x": 1219.2999811961954,
"y": 10368.494996501231
},
{
"x": 1215.9897627121354,
"y": 10378.168714376088
},
{
"x": 1220.8731595137301,
"y": 10344.64280960002
},
{
"x": 1224.0695484289067,
"y": 10348.22359589236
},
{
"x": 1220.703327540945,
"y": 10328.196332964242
},
{
"x": 1215.5613604790785,
"y": 10337.352693380637
}
]
}
],
"drilldown": {},
"tooltip": {
"enabled": true,
"useHTML": false,
"format": null,
"headerFormat": "",
"pointFormat": "<span style=\"color:{series.color}\">Single</span>: <b>{point.x:.0f}</b><br><span style=\"color:{series.color}\">Multi</span>: <b>{point.y:.0f}</b>",
"footerFormat": "",
"shared": false,
"outside": false,
"valueDecimals": null,
"split": false
},
"annotations": null
},
"hc_type": "chart",
"id": "43941304429233777781899971657388992486"
}
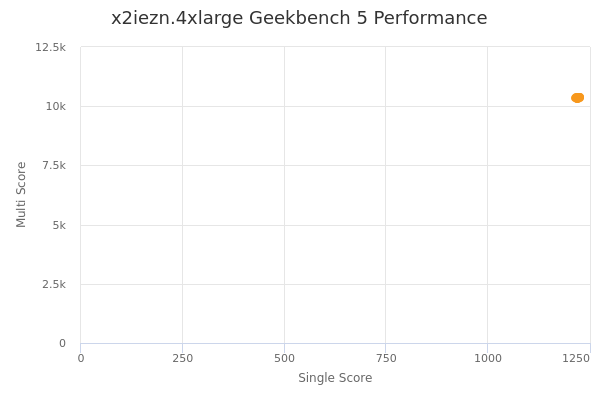
| Single | Multi | |
|---|---|---|
| Max | 1226 | 10388 |
| Average | 1221 | 10349 |
| Deviation | 3.30 | 22.39 |
| Min | 1216 | 10314 |
Sign up as Freemium to get more insight.