t3.xlarge by Amazon Web Services
Geekbench is a cross-platform processor benchmark with a scoring system that determines single-core and multi-core performance using loads simulating real-world scenarios. Geekbench 5 score is calculated with a reference score of 2500 representing the performance of the Intel Core i5-2520M @ 2.50 GHz. The software benchmark is available for Mac OS, Windows, Linux, Android and iOS platforms.
Specifications:
CPU
4
RAM
16.0 GB
Net
5000 Mbps
{
"configuration": {
"chart": {
"type": "scatter",
"polar": false,
"zoomType": "",
"options3d": {},
"height": null,
"width": null,
"margin": null,
"inverted": false,
"zooming": {}
},
"credits": {
"enabled": false
},
"title": {
"text": ""
},
"colorAxis": null,
"subtitle": {
"text": ""
},
"xAxis": {
"title": {
"text": [
"Single Score"
],
"useHTML": false,
"style": {
"color": "#666666"
}
},
"categories": null,
"lineWidth": 1,
"tickInterval": null,
"tickWidth": 1,
"tickLength": 10,
"tickPixelInterval": 100,
"plotLines": null,
"labels": {
"enabled": true,
"format": null,
"formatter": "",
"style": {
"color": "#666666",
"cursor": "default",
"fontSize": "11px"
},
"useHTML": false,
"step": 0
},
"plotBands": null,
"visible": true,
"floor": null,
"ceiling": null,
"type": "linear",
"min": 0,
"gridLineWidth": 1,
"gridLineColor": "#e6e6e6",
"minorTickInterval": null,
"minorTickWidth": 0,
"minTickInterval": null,
"startOnTick": true,
"endOnTick": true,
"tickmarkPlacement": 100,
"units": 100,
"minRange": 100
},
"yAxis": {
"title": {
"text": [
"Multi Score"
],
"useHTML": false,
"style": {
"color": "#666666"
}
},
"categories": null,
"plotLines": null,
"plotBands": null,
"lineWidth": null,
"tickInterval": null,
"tickLength": 10,
"floor": null,
"ceiling": null,
"gridLineInterpolation": null,
"gridLineWidth": 1,
"gridLineColor": "#e6e6e6",
"min": 0,
"max": null,
"minorTickInterval": null,
"minorTickWidth": 0,
"minTickInterval": null,
"startOnTick": true,
"endOnTick": true,
"minRange": null,
"type": "linear",
"tickmarkPlacement": null,
"labels": {
"enabled": true,
"formatter": null,
"style": {
"color": "#666666",
"cursor": "default",
"fontSize": "11px"
},
"useHTML": false
}
},
"zAxis": {
"title": {
"text": "Multi Score"
}
},
"plotOptions": {
"series": {
"dataLabels": {
"enabled": false,
"format": null,
"distance": 30,
"align": "center",
"inside": null,
"allowOverlap": false,
"style": {
"fontSize": "11px"
}
},
"showInLegend": null,
"turboThreshold": 0,
"stacking": "",
"groupPadding": 0.2,
"centerInCategory": false,
"findNearestPointBy": "x"
}
},
"navigator": {
"enabled": false
},
"scrollbar": {
"enabled": false
},
"rangeSelector": {
"enabled": false,
"inputEnabled": false
},
"legend": {
"enabled": null,
"maxHeight": null,
"align": "center",
"verticalAlign": "bottom",
"layout": "horizontal",
"width": null,
"margin": 12,
"reversed": false
},
"series": [
{
"name": "t3.xlarge by Amazon Web Services",
"color": "#f7981d",
"data": [
{
"x": 820.2836463449504,
"y": 1958.7358649829584
},
{
"x": 670.0059101296055,
"y": 1816.280694056418
},
{
"x": 822.8285009501489,
"y": 1971.0401254304354
},
{
"x": 651.8162031408817,
"y": 1850.3167541085918
},
{
"x": 810.3310874646669,
"y": 1967.2734139899508
},
{
"x": 659.178875651879,
"y": 1776.7363373665694
},
{
"x": 821.2804499041803,
"y": 1961.4993128967362
},
{
"x": 683.4519934077382,
"y": 1823.6586994060276
},
{
"x": 803.639942245806,
"y": 1959.487007420783
},
{
"x": 632.7406822903695,
"y": 1697.9233670919202
},
{
"x": 783.5884812270119,
"y": 1765.8903151456434
},
{
"x": 696.4848029721225,
"y": 1827.5205800172612
},
{
"x": 729.5979703023619,
"y": 1859.277190356383
},
{
"x": 716.673760855652,
"y": 1813.3266794225087
},
{
"x": 760.1469726785675,
"y": 1867.925743125249
},
{
"x": 699.4180086567426,
"y": 1857.238753730229
},
{
"x": 719.6377014310931,
"y": 1841.8364524313238
},
{
"x": 715.9492344944044,
"y": 1826.0325080967705
},
{
"x": 752.8623412622128,
"y": 1804.9498882139346
},
{
"x": 724.8433039927877,
"y": 1733.2149630405443
},
{
"x": 742.0498626389945,
"y": 1793.0489241929895
},
{
"x": 701.5377502574454,
"y": 1743.0075560856253
},
{
"x": 732.515254062602,
"y": 1746.765579569546
},
{
"x": 684.6923639765666,
"y": 1906.0386932718386
},
{
"x": 707.4279164031545,
"y": 1820.9215598597652
},
{
"x": 721.504296424528,
"y": 1774.182743183003
},
{
"x": 723.9670181579693,
"y": 1832.3570053178719
},
{
"x": 745.4278513350666,
"y": 1805.8205217596858
},
{
"x": 742.4388537881715,
"y": 1895.8131624882326
},
{
"x": 717.6636449640654,
"y": 1750.9152247393095
}
]
}
],
"drilldown": {},
"tooltip": {
"enabled": true,
"useHTML": false,
"format": null,
"headerFormat": "",
"pointFormat": "<span style=\"color:{series.color}\">Single</span>: <b>{point.x:.0f}</b><br><span style=\"color:{series.color}\">Multi</span>: <b>{point.y:.0f}</b>",
"footerFormat": "",
"shared": false,
"outside": false,
"valueDecimals": null,
"split": false
},
"annotations": null
},
"hc_type": "chart",
"id": "150269983304014283536601612930519498633"
}
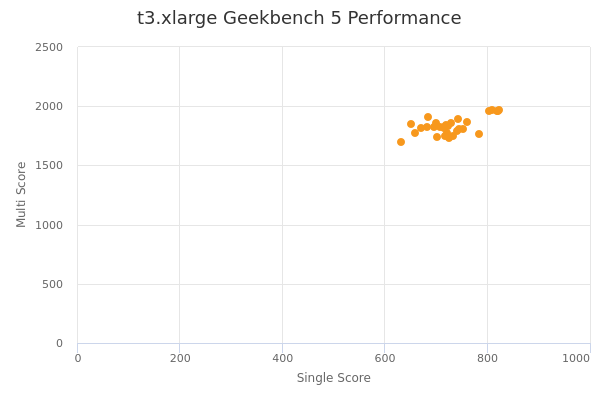
| Single | Multi | |
|---|---|---|
| Max | 823 | 1971 |
| Average | 730 | 1835 |
| Deviation | 49.79 | 73.74 |
| Min | 633 | 1698 |