t3.medium by Amazon Web Services
Geekbench is a cross-platform processor benchmark with a scoring system that determines single-core and multi-core performance using loads simulating real-world scenarios. Geekbench 5 score is calculated with a reference score of 2500 representing the performance of the Intel Core i5-2520M @ 2.50 GHz. The software benchmark is available for Mac OS, Windows, Linux, Android and iOS platforms.
Specifications:
CPU
2
RAM
4.0 GB
Net
5000 Mbps
{
"configuration": {
"chart": {
"type": "scatter",
"polar": false,
"zoomType": "",
"options3d": {},
"height": null,
"width": null,
"margin": null,
"inverted": false,
"zooming": {}
},
"credits": {
"enabled": false
},
"title": {
"text": ""
},
"colorAxis": null,
"subtitle": {
"text": ""
},
"xAxis": {
"title": {
"text": [
"Single Score"
],
"useHTML": false,
"style": {
"color": "#666666"
}
},
"categories": null,
"lineWidth": 1,
"tickInterval": null,
"tickWidth": 1,
"tickLength": 10,
"tickPixelInterval": 100,
"plotLines": null,
"labels": {
"enabled": true,
"format": null,
"formatter": "",
"style": {
"color": "#666666",
"cursor": "default",
"fontSize": "11px"
},
"useHTML": false,
"step": 0
},
"plotBands": null,
"visible": true,
"floor": null,
"ceiling": null,
"type": "linear",
"min": 0,
"gridLineWidth": 1,
"gridLineColor": "#e6e6e6",
"minorTickInterval": null,
"minorTickWidth": 0,
"minTickInterval": null,
"startOnTick": true,
"endOnTick": true,
"tickmarkPlacement": 100,
"units": 100,
"minRange": 100
},
"yAxis": {
"title": {
"text": [
"Multi Score"
],
"useHTML": false,
"style": {
"color": "#666666"
}
},
"categories": null,
"plotLines": null,
"plotBands": null,
"lineWidth": null,
"tickInterval": null,
"tickLength": 10,
"floor": null,
"ceiling": null,
"gridLineInterpolation": null,
"gridLineWidth": 1,
"gridLineColor": "#e6e6e6",
"min": 0,
"max": null,
"minorTickInterval": null,
"minorTickWidth": 0,
"minTickInterval": null,
"startOnTick": true,
"endOnTick": true,
"minRange": null,
"type": "linear",
"tickmarkPlacement": null,
"labels": {
"enabled": true,
"formatter": null,
"style": {
"color": "#666666",
"cursor": "default",
"fontSize": "11px"
},
"useHTML": false
}
},
"zAxis": {
"title": {
"text": "Multi Score"
}
},
"plotOptions": {
"series": {
"dataLabels": {
"enabled": false,
"format": null,
"distance": 30,
"align": "center",
"inside": null,
"allowOverlap": false,
"style": {
"fontSize": "11px"
}
},
"showInLegend": null,
"turboThreshold": 0,
"stacking": "",
"groupPadding": 0.2,
"centerInCategory": false,
"findNearestPointBy": "x"
}
},
"navigator": {
"enabled": false
},
"scrollbar": {
"enabled": false
},
"rangeSelector": {
"enabled": false,
"inputEnabled": false
},
"legend": {
"enabled": null,
"maxHeight": null,
"align": "center",
"verticalAlign": "bottom",
"layout": "horizontal",
"width": null,
"margin": 12,
"reversed": false
},
"series": [
{
"name": "t3.medium by Amazon Web Services",
"color": "#f7981d",
"data": [
{
"x": 711.238244195,
"y": 957.097132328
},
{
"x": 719.770208406,
"y": 949.202701149
},
{
"x": 730.51184174,
"y": 961.13124704
},
{
"x": 699.881279019,
"y": 978.76465325
},
{
"x": 717.828055885,
"y": 971.965030997
},
{
"x": 777.7774720705793,
"y": 961.9001737446033
},
{
"x": 672.0387950712674,
"y": 960.9749419293919
},
{
"x": 804.8179908440579,
"y": 989.9214419168591
},
{
"x": 703.6753167213609,
"y": 929.5112807225887
},
{
"x": 795.1637084425954,
"y": 927.0974191142811
},
{
"x": 697.1424340560893,
"y": 894.2789391715401
},
{
"x": 805.6541101355219,
"y": 1001.6424855917326
},
{
"x": 646.0387596221,
"y": 943.4781899969886
},
{
"x": 761.7283522610851,
"y": 972.8620957498002
},
{
"x": 700.4827575987813,
"y": 963.2707735393917
},
{
"x": 794.8857074180145,
"y": 965.9942863253768
},
{
"x": 656.8181909663361,
"y": 954.6264942763617
},
{
"x": 796.3069368291624,
"y": 978.2200277319355
},
{
"x": 673.6210092983084,
"y": 893.5255963729426
},
{
"x": 803.091262438465,
"y": 948.2985729603743
},
{
"x": 651.3450466165634,
"y": 939.7538439546299
},
{
"x": 775.6841677906243,
"y": 947.5964453342976
},
{
"x": 711.4945978398181,
"y": 929.7854703644546
},
{
"x": 783.1348438558915,
"y": 945.6837274747502
},
{
"x": 721.0565608404169,
"y": 975.5264334789854
}
]
}
],
"drilldown": {},
"tooltip": {
"enabled": true,
"useHTML": false,
"format": null,
"headerFormat": "",
"pointFormat": "<span style=\"color:{series.color}\">Single</span>: <b>{point.x:.0f}</b><br><span style=\"color:{series.color}\">Multi</span>: <b>{point.y:.0f}</b>",
"footerFormat": "",
"shared": false,
"outside": false,
"valueDecimals": null,
"split": false
},
"annotations": null
},
"hc_type": "chart",
"id": "3844230790273597963290926811679017993"
}
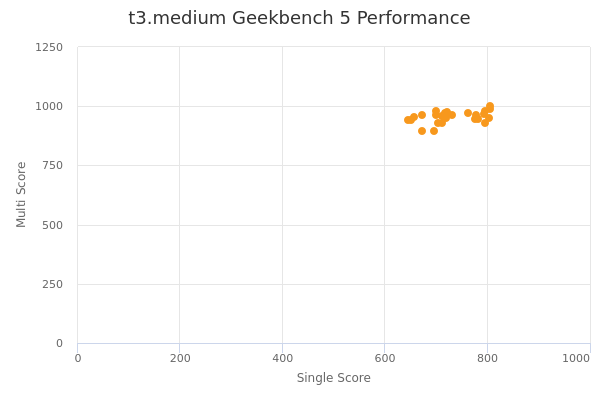
| Single | Multi | |
|---|---|---|
| Max | 806 | 1002 |
| Average | 732 | 954 |
| Deviation | 51.87 | 25.23 |
| Min | 646 | 894 |