r5d.8xlarge by Amazon Web Services
Geekbench is a cross-platform processor benchmark with a scoring system that determines single-core and multi-core performance using loads simulating real-world scenarios. Geekbench 5 score is calculated with a reference score of 2500 representing the performance of the Intel Core i5-2520M @ 2.50 GHz. The software benchmark is available for Mac OS, Windows, Linux, Android and iOS platforms.
Specifications:
CPU
32
RAM
256.0 GB
Extra
2x
600 GB
NVMe SSD
Net
10000 Mbps
{
"configuration": {
"chart": {
"type": "scatter",
"polar": false,
"zoomType": "",
"options3d": {},
"height": null,
"width": null,
"margin": null,
"inverted": false,
"zooming": {}
},
"credits": {
"enabled": false
},
"title": {
"text": ""
},
"colorAxis": null,
"subtitle": {
"text": ""
},
"xAxis": {
"title": {
"text": [
"Single Score"
],
"useHTML": false,
"style": {
"color": "#666666"
}
},
"categories": null,
"lineWidth": 1,
"tickInterval": null,
"tickWidth": 1,
"tickLength": 10,
"tickPixelInterval": 100,
"plotLines": null,
"labels": {
"enabled": true,
"format": null,
"formatter": "",
"style": {
"color": "#666666",
"cursor": "default",
"fontSize": "11px"
},
"useHTML": false,
"step": 0
},
"plotBands": null,
"visible": true,
"floor": null,
"ceiling": null,
"type": "linear",
"min": 0,
"gridLineWidth": 1,
"gridLineColor": "#e6e6e6",
"minorTickInterval": null,
"minorTickWidth": 0,
"minTickInterval": null,
"startOnTick": true,
"endOnTick": true,
"tickmarkPlacement": 100,
"units": 100,
"minRange": 100
},
"yAxis": {
"title": {
"text": [
"Multi Score"
],
"useHTML": false,
"style": {
"color": "#666666"
}
},
"categories": null,
"plotLines": null,
"plotBands": null,
"lineWidth": null,
"tickInterval": null,
"tickLength": 10,
"floor": null,
"ceiling": null,
"gridLineInterpolation": null,
"gridLineWidth": 1,
"gridLineColor": "#e6e6e6",
"min": 0,
"max": null,
"minorTickInterval": null,
"minorTickWidth": 0,
"minTickInterval": null,
"startOnTick": true,
"endOnTick": true,
"minRange": null,
"type": "linear",
"tickmarkPlacement": null,
"labels": {
"enabled": true,
"formatter": null,
"style": {
"color": "#666666",
"cursor": "default",
"fontSize": "11px"
},
"useHTML": false
}
},
"zAxis": {
"title": {
"text": "Multi Score"
}
},
"plotOptions": {
"series": {
"dataLabels": {
"enabled": false,
"format": null,
"distance": 30,
"align": "center",
"inside": null,
"allowOverlap": false,
"style": {
"fontSize": "11px"
}
},
"showInLegend": null,
"turboThreshold": 0,
"stacking": "",
"groupPadding": 0.2,
"centerInCategory": false,
"findNearestPointBy": "x"
}
},
"navigator": {
"enabled": false
},
"scrollbar": {
"enabled": false
},
"rangeSelector": {
"enabled": false,
"inputEnabled": false
},
"legend": {
"enabled": null,
"maxHeight": null,
"align": "center",
"verticalAlign": "bottom",
"layout": "horizontal",
"width": null,
"margin": 12,
"reversed": false
},
"series": [
{
"name": "r5d.8xlarge by Amazon Web Services",
"color": "#f7981d",
"data": [
{
"x": 914.6871279700642,
"y": 14713.468670381966
},
{
"x": 913.7122188005646,
"y": 14661.811797460323
},
{
"x": 917.1375580669787,
"y": 14720.44261191737
},
{
"x": 913.794345179716,
"y": 14653.628563576676
},
{
"x": 916.1516506793416,
"y": 14727.753263612598
},
{
"x": 912.2189959701134,
"y": 14659.249192211963
},
{
"x": 916.9541271426178,
"y": 14718.55773618321
},
{
"x": 912.4954855781652,
"y": 14713.277922068433
},
{
"x": 915.1439668529122,
"y": 14743.914665946402
},
{
"x": 913.2042606006726,
"y": 14645.488436246891
},
{
"x": 915.637001200987,
"y": 14800.961268406136
},
{
"x": 912.6102795040313,
"y": 14695.471649294766
},
{
"x": 912.1478066565176,
"y": 14665.263249879754
},
{
"x": 912.9277066785547,
"y": 14681.68928236911
},
{
"x": 918.460387614699,
"y": 14705.819961430305
},
{
"x": 915.9898645127186,
"y": 14726.436952082626
},
{
"x": 915.4349016300903,
"y": 14731.870644755738
},
{
"x": 914.7935987089031,
"y": 14681.867066370025
},
{
"x": 918.0713181112956,
"y": 14632.286057346088
},
{
"x": 912.2039654882774,
"y": 14718.020322180575
}
]
}
],
"drilldown": {},
"tooltip": {
"enabled": true,
"useHTML": false,
"format": null,
"headerFormat": "",
"pointFormat": "<span style=\"color:{series.color}\">Single</span>: <b>{point.x:.0f}</b><br><span style=\"color:{series.color}\">Multi</span>: <b>{point.y:.0f}</b>",
"footerFormat": "",
"shared": false,
"outside": false,
"valueDecimals": null,
"split": false
},
"annotations": null
},
"hc_type": "chart",
"id": "30067076031139408969041213940465018467"
}
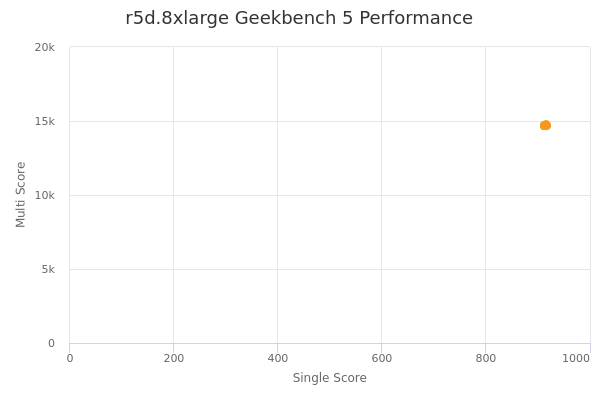
| Single | Multi | |
|---|---|---|
| Max | 918 | 14801 |
| Average | 915 | 14700 |
| Deviation | 1.96 | 39.24 |
| Min | 912 | 14632 |
Sign up as Freemium to get more insight.