r5d.4xlarge by Amazon Web Services
Geekbench is a cross-platform processor benchmark with a scoring system that determines single-core and multi-core performance using loads simulating real-world scenarios. Geekbench 5 score is calculated with a reference score of 2500 representing the performance of the Intel Core i5-2520M @ 2.50 GHz. The software benchmark is available for Mac OS, Windows, Linux, Android and iOS platforms.
Specifications:
CPU
16
RAM
128.0 GB
Extra
2x
300 GB
NVMe SSD
Net
10000 Mbps
{
"configuration": {
"chart": {
"type": "scatter",
"polar": false,
"zoomType": "",
"options3d": {},
"height": null,
"width": null,
"margin": null,
"inverted": false,
"zooming": {}
},
"credits": {
"enabled": false
},
"title": {
"text": ""
},
"colorAxis": null,
"subtitle": {
"text": ""
},
"xAxis": {
"title": {
"text": [
"Single Score"
],
"useHTML": false,
"style": {
"color": "#666666"
}
},
"categories": null,
"lineWidth": 1,
"tickInterval": null,
"tickWidth": 1,
"tickLength": 10,
"tickPixelInterval": 100,
"plotLines": null,
"labels": {
"enabled": true,
"format": null,
"formatter": "",
"style": {
"color": "#666666",
"cursor": "default",
"fontSize": "11px"
},
"useHTML": false,
"step": 0
},
"plotBands": null,
"visible": true,
"floor": null,
"ceiling": null,
"type": "linear",
"min": 0,
"gridLineWidth": 1,
"gridLineColor": "#e6e6e6",
"minorTickInterval": null,
"minorTickWidth": 0,
"minTickInterval": null,
"startOnTick": true,
"endOnTick": true,
"tickmarkPlacement": 100,
"units": 100,
"minRange": 100
},
"yAxis": {
"title": {
"text": [
"Multi Score"
],
"useHTML": false,
"style": {
"color": "#666666"
}
},
"categories": null,
"plotLines": null,
"plotBands": null,
"lineWidth": null,
"tickInterval": null,
"tickLength": 10,
"floor": null,
"ceiling": null,
"gridLineInterpolation": null,
"gridLineWidth": 1,
"gridLineColor": "#e6e6e6",
"min": 0,
"max": null,
"minorTickInterval": null,
"minorTickWidth": 0,
"minTickInterval": null,
"startOnTick": true,
"endOnTick": true,
"minRange": null,
"type": "linear",
"tickmarkPlacement": null,
"labels": {
"enabled": true,
"formatter": null,
"style": {
"color": "#666666",
"cursor": "default",
"fontSize": "11px"
},
"useHTML": false
}
},
"zAxis": {
"title": {
"text": "Multi Score"
}
},
"plotOptions": {
"series": {
"dataLabels": {
"enabled": false,
"format": null,
"distance": 30,
"align": "center",
"inside": null,
"allowOverlap": false,
"style": {
"fontSize": "11px"
}
},
"showInLegend": null,
"turboThreshold": 0,
"stacking": "",
"groupPadding": 0.2,
"centerInCategory": false,
"findNearestPointBy": "x"
}
},
"navigator": {
"enabled": false
},
"scrollbar": {
"enabled": false
},
"rangeSelector": {
"enabled": false,
"inputEnabled": false
},
"legend": {
"enabled": null,
"maxHeight": null,
"align": "center",
"verticalAlign": "bottom",
"layout": "horizontal",
"width": null,
"margin": 12,
"reversed": false
},
"series": [
{
"name": "r5d.4xlarge by Amazon Web Services",
"color": "#f7981d",
"data": [
{
"x": 887.577552531522,
"y": 7651.93278471717
},
{
"x": 878.3969543800583,
"y": 7654.712604599389
},
{
"x": 882.3302430792553,
"y": 7659.184988676365
},
{
"x": 874.9921510038434,
"y": 7660.691154170172
},
{
"x": 882.5697541277775,
"y": 7663.545854395617
},
{
"x": 880.5310202775132,
"y": 7632.995190896238
},
{
"x": 887.1277449886986,
"y": 7671.599403720647
},
{
"x": 879.2565192254465,
"y": 7652.680539284769
},
{
"x": 887.8311750409689,
"y": 7660.7301734471275
},
{
"x": 878.7218814604671,
"y": 7648.737643020103
},
{
"x": 886.4253968562466,
"y": 7690.517771042327
},
{
"x": 881.7600253732909,
"y": 7626.817711578136
},
{
"x": 886.177984137862,
"y": 7662.331750364161
},
{
"x": 878.4447346364327,
"y": 7638.465012174633
},
{
"x": 884.7537751673037,
"y": 7647.745247038108
},
{
"x": 875.547503211279,
"y": 7629.005209313685
},
{
"x": 885.8400048399344,
"y": 7662.524560577203
},
{
"x": 876.7253014327991,
"y": 7627.009681303305
},
{
"x": 884.4403282193387,
"y": 7664.999240847454
},
{
"x": 877.126273856727,
"y": 7630.643930575334
},
{
"x": 915.9766947489093,
"y": 7881.873224207124
},
{
"x": 885.4512643702767,
"y": 7631.36441077187
},
{
"x": 918.0545479462169,
"y": 7898.098427761495
},
{
"x": 880.2890457512644,
"y": 7633.711586421546
},
{
"x": 913.9192285605656,
"y": 7894.557213356953
},
{
"x": 879.8007092904647,
"y": 7638.401539509954
},
{
"x": 912.9605586476171,
"y": 7876.111672355479
},
{
"x": 880.7966046693325,
"y": 7653.518594044381
},
{
"x": 918.327078169176,
"y": 7887.683398480236
},
{
"x": 882.8817693714429,
"y": 7643.410928462752
},
{
"x": 917.6130998884847,
"y": 7878.4353240563905
},
{
"x": 880.5867307502901,
"y": 7636.609929764139
},
{
"x": 915.1801178562589,
"y": 7878.423310439935
},
{
"x": 880.416211285228,
"y": 7628.33160887827
},
{
"x": 913.6246226824132,
"y": 7884.581804447393
},
{
"x": 885.7424266306582,
"y": 7645.95642275311
},
{
"x": 913.023926109941,
"y": 7858.836547450894
},
{
"x": 878.166104429662,
"y": 7602.404072671536
},
{
"x": 914.9846781130434,
"y": 7889.247206962363
},
{
"x": 883.3631401689823,
"y": 7651.425481583567
}
]
}
],
"drilldown": {},
"tooltip": {
"enabled": true,
"useHTML": false,
"format": null,
"headerFormat": "",
"pointFormat": "<span style=\"color:{series.color}\">Single</span>: <b>{point.x:.0f}</b><br><span style=\"color:{series.color}\">Multi</span>: <b>{point.y:.0f}</b>",
"footerFormat": "",
"shared": false,
"outside": false,
"valueDecimals": null,
"split": false
},
"annotations": null
},
"hc_type": "chart",
"id": "93527542671922630977722831904233525594"
}
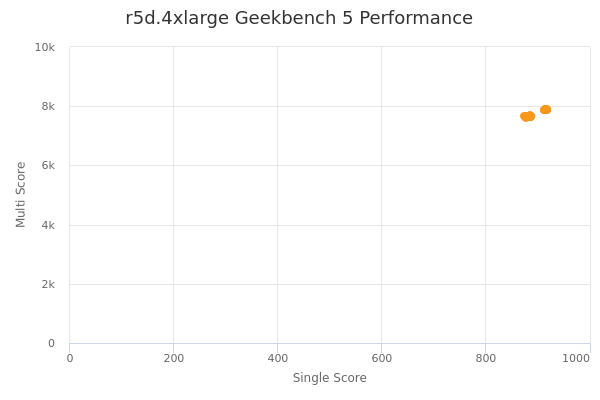
| Single | Multi | |
|---|---|---|
| Max | 918 | 7898 |
| Average | 890 | 7706 |
| Deviation | 14.91 | 103.43 |
| Min | 875 | 7602 |
Sign up as Freemium to get more insight.