r5d.12xlarge by Amazon Web Services
Geekbench is a cross-platform processor benchmark with a scoring system that determines single-core and multi-core performance using loads simulating real-world scenarios. Geekbench 5 score is calculated with a reference score of 2500 representing the performance of the Intel Core i5-2520M @ 2.50 GHz. The software benchmark is available for Mac OS, Windows, Linux, Android and iOS platforms.
Specifications:
CPU
48
RAM
384.0 GB
Extra
2x
900 GB
NVMe SSD
Net
10000 Mbps
{
"configuration": {
"chart": {
"type": "scatter",
"polar": false,
"zoomType": "",
"options3d": {},
"height": null,
"width": null,
"margin": null,
"inverted": false,
"zooming": {}
},
"credits": {
"enabled": false
},
"title": {
"text": ""
},
"colorAxis": null,
"subtitle": {
"text": ""
},
"xAxis": {
"title": {
"text": [
"Single Score"
],
"useHTML": false,
"style": {
"color": "#666666"
}
},
"categories": null,
"lineWidth": 1,
"tickInterval": null,
"tickWidth": 1,
"tickLength": 10,
"tickPixelInterval": 100,
"plotLines": null,
"labels": {
"enabled": true,
"format": null,
"formatter": "",
"style": {
"color": "#666666",
"cursor": "default",
"fontSize": "11px"
},
"useHTML": false,
"step": 0
},
"plotBands": null,
"visible": true,
"floor": null,
"ceiling": null,
"type": "linear",
"min": 0,
"gridLineWidth": 1,
"gridLineColor": "#e6e6e6",
"minorTickInterval": null,
"minorTickWidth": 0,
"minTickInterval": null,
"startOnTick": true,
"endOnTick": true,
"tickmarkPlacement": 100,
"units": 100,
"minRange": 100
},
"yAxis": {
"title": {
"text": [
"Multi Score"
],
"useHTML": false,
"style": {
"color": "#666666"
}
},
"categories": null,
"plotLines": null,
"plotBands": null,
"lineWidth": null,
"tickInterval": null,
"tickLength": 10,
"floor": null,
"ceiling": null,
"gridLineInterpolation": null,
"gridLineWidth": 1,
"gridLineColor": "#e6e6e6",
"min": 0,
"max": null,
"minorTickInterval": null,
"minorTickWidth": 0,
"minTickInterval": null,
"startOnTick": true,
"endOnTick": true,
"minRange": null,
"type": "linear",
"tickmarkPlacement": null,
"labels": {
"enabled": true,
"formatter": null,
"style": {
"color": "#666666",
"cursor": "default",
"fontSize": "11px"
},
"useHTML": false
}
},
"zAxis": {
"title": {
"text": "Multi Score"
}
},
"plotOptions": {
"series": {
"dataLabels": {
"enabled": false,
"format": null,
"distance": 30,
"align": "center",
"inside": null,
"allowOverlap": false,
"style": {
"fontSize": "11px"
}
},
"showInLegend": null,
"turboThreshold": 0,
"stacking": "",
"groupPadding": 0.2,
"centerInCategory": false,
"findNearestPointBy": "x"
}
},
"navigator": {
"enabled": false
},
"scrollbar": {
"enabled": false
},
"rangeSelector": {
"enabled": false,
"inputEnabled": false
},
"legend": {
"enabled": null,
"maxHeight": null,
"align": "center",
"verticalAlign": "bottom",
"layout": "horizontal",
"width": null,
"margin": 12,
"reversed": false
},
"series": [
{
"name": "r5d.12xlarge by Amazon Web Services",
"color": "#f7981d",
"data": [
{
"x": 953.7579780337127,
"y": 19736.16824673558
},
{
"x": 950.345300424376,
"y": 19707.818188735397
},
{
"x": 955.3704492983109,
"y": 19784.724968509658
},
{
"x": 956.0798574944449,
"y": 19754.01633552553
},
{
"x": 953.2579594153492,
"y": 19804.916075785848
},
{
"x": 956.4059577794816,
"y": 19757.946101095466
},
{
"x": 953.2326238786053,
"y": 19765.60959055101
},
{
"x": 952.7851156161498,
"y": 19718.529331338268
},
{
"x": 954.2769327237097,
"y": 19711.160651521423
},
{
"x": 957.1388465365565,
"y": 19724.376014561953
},
{
"x": 953.661321173805,
"y": 19767.118431092174
},
{
"x": 957.8354857290778,
"y": 19769.86114819709
},
{
"x": 953.5808367094157,
"y": 19743.454230315503
},
{
"x": 949.7250758272393,
"y": 19773.5119253421
},
{
"x": 952.6431125260974,
"y": 19708.21351651047
},
{
"x": 954.8054442392082,
"y": 19761.345100877563
},
{
"x": 953.7859872851516,
"y": 19740.642474296485
},
{
"x": 956.5383173945256,
"y": 19800.548579392445
},
{
"x": 952.8627818312023,
"y": 19809.99894553964
},
{
"x": 953.0092260008821,
"y": 19753.157507988137
}
]
}
],
"drilldown": {},
"tooltip": {
"enabled": true,
"useHTML": false,
"format": null,
"headerFormat": "",
"pointFormat": "<span style=\"color:{series.color}\">Single</span>: <b>{point.x:.0f}</b><br><span style=\"color:{series.color}\">Multi</span>: <b>{point.y:.0f}</b>",
"footerFormat": "",
"shared": false,
"outside": false,
"valueDecimals": null,
"split": false
},
"annotations": null
},
"hc_type": "chart",
"id": "112470361631374200442568398428018812006"
}
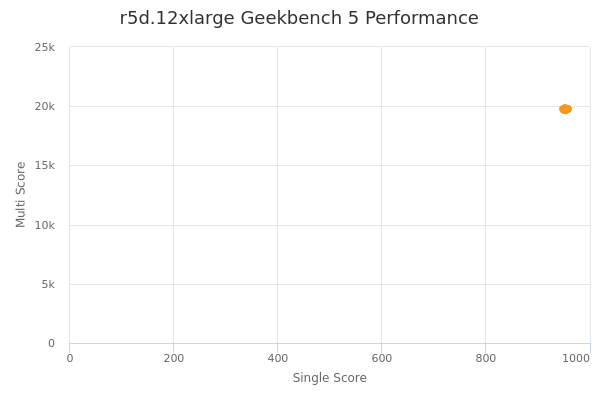
| Single | Multi | |
|---|---|---|
| Max | 958 | 19810 |
| Average | 954 | 19755 |
| Deviation | 2.03 | 30.53 |
| Min | 950 | 19708 |
Sign up as Freemium to get more insight.