i3en.6xlarge by Amazon Web Services
Geekbench is a cross-platform processor benchmark with a scoring system that determines single-core and multi-core performance using loads simulating real-world scenarios. Geekbench 5 score is calculated with a reference score of 2500 representing the performance of the Intel Core i5-2520M @ 2.50 GHz. The software benchmark is available for Mac OS, Windows, Linux, Android and iOS platforms.
Specifications:
CPU
24
RAM
192.0 GB
Extra
2x
7500 GB
NVMe SSD
Net
25000 Mbps
{
"configuration": {
"chart": {
"type": "scatter",
"polar": false,
"zoomType": "",
"options3d": {},
"height": null,
"width": null,
"margin": null,
"inverted": false,
"zooming": {}
},
"credits": {
"enabled": false
},
"title": {
"text": ""
},
"colorAxis": null,
"subtitle": {
"text": ""
},
"xAxis": {
"title": {
"text": [
"Single Score"
],
"useHTML": false,
"style": {
"color": "#666666"
}
},
"categories": null,
"lineWidth": 1,
"tickInterval": null,
"tickWidth": 1,
"tickLength": 10,
"tickPixelInterval": 100,
"plotLines": null,
"labels": {
"enabled": true,
"format": null,
"formatter": "",
"style": {
"color": "#666666",
"cursor": "default",
"fontSize": "11px"
},
"useHTML": false,
"step": 0
},
"plotBands": null,
"visible": true,
"floor": null,
"ceiling": null,
"type": "linear",
"min": 0,
"gridLineWidth": 1,
"gridLineColor": "#e6e6e6",
"minorTickInterval": null,
"minorTickWidth": 0,
"minTickInterval": null,
"startOnTick": true,
"endOnTick": true,
"tickmarkPlacement": 100,
"units": 100,
"minRange": 100
},
"yAxis": {
"title": {
"text": [
"Multi Score"
],
"useHTML": false,
"style": {
"color": "#666666"
}
},
"categories": null,
"plotLines": null,
"plotBands": null,
"lineWidth": null,
"tickInterval": null,
"tickLength": 10,
"floor": null,
"ceiling": null,
"gridLineInterpolation": null,
"gridLineWidth": 1,
"gridLineColor": "#e6e6e6",
"min": 0,
"max": null,
"minorTickInterval": null,
"minorTickWidth": 0,
"minTickInterval": null,
"startOnTick": true,
"endOnTick": true,
"minRange": null,
"type": "linear",
"tickmarkPlacement": null,
"labels": {
"enabled": true,
"formatter": null,
"style": {
"color": "#666666",
"cursor": "default",
"fontSize": "11px"
},
"useHTML": false
}
},
"zAxis": {
"title": {
"text": "Multi Score"
}
},
"plotOptions": {
"series": {
"dataLabels": {
"enabled": false,
"format": null,
"distance": 30,
"align": "center",
"inside": null,
"allowOverlap": false,
"style": {
"fontSize": "11px"
}
},
"showInLegend": null,
"turboThreshold": 0,
"stacking": "",
"groupPadding": 0.2,
"centerInCategory": false,
"findNearestPointBy": "x"
}
},
"navigator": {
"enabled": false
},
"scrollbar": {
"enabled": false
},
"rangeSelector": {
"enabled": false,
"inputEnabled": false
},
"legend": {
"enabled": null,
"maxHeight": null,
"align": "center",
"verticalAlign": "bottom",
"layout": "horizontal",
"width": null,
"margin": 12,
"reversed": false
},
"series": [
{
"name": "i3en.6xlarge by Amazon Web Services",
"color": "#f7981d",
"data": [
{
"x": 887.0960789419103,
"y": 11200.10738382012
},
{
"x": 852.9663025253551,
"y": 11008.441608933404
},
{
"x": 884.6679846125157,
"y": 11168.952499347188
},
{
"x": 844.2621449637417,
"y": 11048.642853942494
},
{
"x": 886.5011698247936,
"y": 11176.254874369255
},
{
"x": 850.6537725644505,
"y": 10970.906155220637
},
{
"x": 883.4967631140228,
"y": 11168.66343757764
},
{
"x": 860.654345078136,
"y": 11043.786184864899
},
{
"x": 884.569128546181,
"y": 11166.030687199118
},
{
"x": 850.9574469597646,
"y": 11026.745360680112
},
{
"x": 886.2580285168824,
"y": 11132.560144964853
},
{
"x": 853.3505057351015,
"y": 10946.951920337364
},
{
"x": 886.5602159268196,
"y": 11181.127135898058
},
{
"x": 860.4018582097318,
"y": 11020.385426786564
},
{
"x": 886.4500292297932,
"y": 11186.613598823567
},
{
"x": 847.170016679912,
"y": 10990.088221765136
},
{
"x": 881.456751105115,
"y": 11190.661851756186
},
{
"x": 861.2822577745068,
"y": 10967.41543883514
},
{
"x": 888.3847884864351,
"y": 11191.26488015464
},
{
"x": 846.8241143223873,
"y": 11021.95390627702
}
]
}
],
"drilldown": {},
"tooltip": {
"enabled": true,
"useHTML": false,
"format": null,
"headerFormat": "",
"pointFormat": "<span style=\"color:{series.color}\">Single</span>: <b>{point.x:.0f}</b><br><span style=\"color:{series.color}\">Multi</span>: <b>{point.y:.0f}</b>",
"footerFormat": "",
"shared": false,
"outside": false,
"valueDecimals": null,
"split": false
},
"annotations": null
},
"hc_type": "chart",
"id": "21991757897968806354525118849620728481"
}
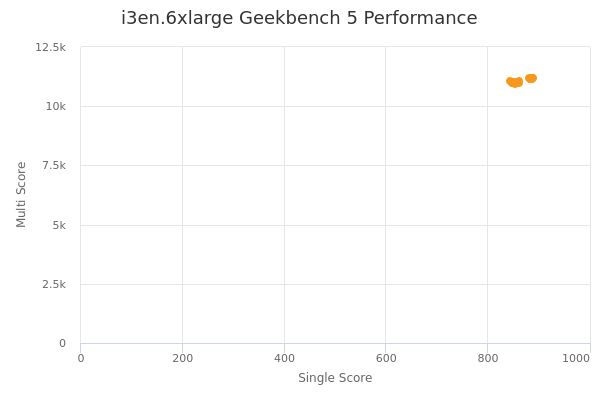
| Single | Multi | |
|---|---|---|
| Max | 888 | 11200 |
| Average | 869 | 11090 |
| Deviation | 16.91 | 89.79 |
| Min | 844 | 10947 |
Sign up as Freemium to get more insight.