i3en.2xlarge by Amazon Web Services
Geekbench is a cross-platform processor benchmark with a scoring system that determines single-core and multi-core performance using loads simulating real-world scenarios. Geekbench 5 score is calculated with a reference score of 2500 representing the performance of the Intel Core i5-2520M @ 2.50 GHz. The software benchmark is available for Mac OS, Windows, Linux, Android and iOS platforms.
Specifications:
CPU
8
RAM
64.0 GB
Extra
2x
2500 GB
NVMe SSD
Net
25000 Mbps
{
"configuration": {
"chart": {
"type": "scatter",
"polar": false,
"zoomType": "",
"options3d": {},
"height": null,
"width": null,
"margin": null,
"inverted": false,
"zooming": {}
},
"credits": {
"enabled": false
},
"title": {
"text": ""
},
"colorAxis": null,
"subtitle": {
"text": ""
},
"xAxis": {
"title": {
"text": [
"Single Score"
],
"useHTML": false,
"style": {
"color": "#666666"
}
},
"categories": null,
"lineWidth": 1,
"tickInterval": null,
"tickWidth": 1,
"tickLength": 10,
"tickPixelInterval": 100,
"plotLines": null,
"labels": {
"enabled": true,
"format": null,
"formatter": "",
"style": {
"color": "#666666",
"cursor": "default",
"fontSize": "11px"
},
"useHTML": false,
"step": 0
},
"plotBands": null,
"visible": true,
"floor": null,
"ceiling": null,
"type": "linear",
"min": 0,
"gridLineWidth": 1,
"gridLineColor": "#e6e6e6",
"minorTickInterval": null,
"minorTickWidth": 0,
"minTickInterval": null,
"startOnTick": true,
"endOnTick": true,
"tickmarkPlacement": 100,
"units": 100,
"minRange": 100
},
"yAxis": {
"title": {
"text": [
"Multi Score"
],
"useHTML": false,
"style": {
"color": "#666666"
}
},
"categories": null,
"plotLines": null,
"plotBands": null,
"lineWidth": null,
"tickInterval": null,
"tickLength": 10,
"floor": null,
"ceiling": null,
"gridLineInterpolation": null,
"gridLineWidth": 1,
"gridLineColor": "#e6e6e6",
"min": 0,
"max": null,
"minorTickInterval": null,
"minorTickWidth": 0,
"minTickInterval": null,
"startOnTick": true,
"endOnTick": true,
"minRange": null,
"type": "linear",
"tickmarkPlacement": null,
"labels": {
"enabled": true,
"formatter": null,
"style": {
"color": "#666666",
"cursor": "default",
"fontSize": "11px"
},
"useHTML": false
}
},
"zAxis": {
"title": {
"text": "Multi Score"
}
},
"plotOptions": {
"series": {
"dataLabels": {
"enabled": false,
"format": null,
"distance": 30,
"align": "center",
"inside": null,
"allowOverlap": false,
"style": {
"fontSize": "11px"
}
},
"showInLegend": null,
"turboThreshold": 0,
"stacking": "",
"groupPadding": 0.2,
"centerInCategory": false,
"findNearestPointBy": "x"
}
},
"navigator": {
"enabled": false
},
"scrollbar": {
"enabled": false
},
"rangeSelector": {
"enabled": false,
"inputEnabled": false
},
"legend": {
"enabled": null,
"maxHeight": null,
"align": "center",
"verticalAlign": "bottom",
"layout": "horizontal",
"width": null,
"margin": 12,
"reversed": false
},
"series": [
{
"name": "i3en.2xlarge by Amazon Web Services",
"color": "#f7981d",
"data": [
{
"x": 897.7490093571457,
"y": 4100.1903611039315
},
{
"x": 838.1157318371517,
"y": 3876.311101037978
},
{
"x": 890.7378296484881,
"y": 4094.4543631852457
},
{
"x": 841.3796093614035,
"y": 3895.211732402256
},
{
"x": 897.0075098364434,
"y": 4104.354907009713
},
{
"x": 844.2461832679003,
"y": 3875.7100249969276
},
{
"x": 887.817346438201,
"y": 4098.930974630157
},
{
"x": 838.9295596361923,
"y": 3909.728450550614
},
{
"x": 892.6962322481511,
"y": 4101.838277629171
},
{
"x": 840.9810621810603,
"y": 3865.903316276912
},
{
"x": 891.3416618953984,
"y": 4114.366406858585
},
{
"x": 841.3546709337902,
"y": 3892.9200610012376
},
{
"x": 894.5171707791118,
"y": 4100.288206632449
},
{
"x": 841.5826712846992,
"y": 3865.744599912634
},
{
"x": 896.7237886789505,
"y": 4097.475992994136
},
{
"x": 835.3016730238583,
"y": 3899.9145057718933
},
{
"x": 886.9851906020936,
"y": 4113.759328552364
},
{
"x": 828.2175656739563,
"y": 3919.822329745488
},
{
"x": 899.0162081617093,
"y": 4089.695366179736
},
{
"x": 841.5912179339234,
"y": 3896.824941569882
}
]
}
],
"drilldown": {},
"tooltip": {
"enabled": true,
"useHTML": false,
"format": null,
"headerFormat": "",
"pointFormat": "<span style=\"color:{series.color}\">Single</span>: <b>{point.x:.0f}</b><br><span style=\"color:{series.color}\">Multi</span>: <b>{point.y:.0f}</b>",
"footerFormat": "",
"shared": false,
"outside": false,
"valueDecimals": null,
"split": false
},
"annotations": null
},
"hc_type": "chart",
"id": "120945350107514373242372336374772782371"
}
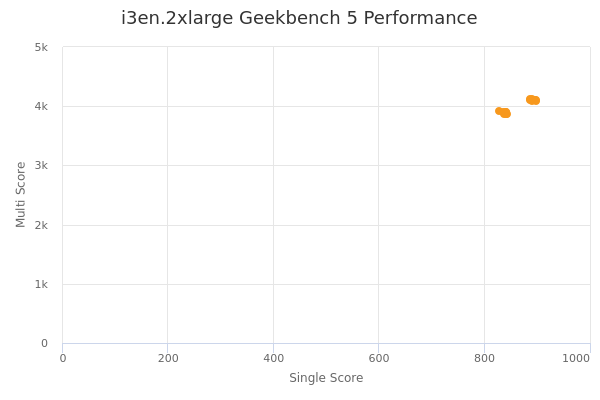
| Single | Multi | |
|---|---|---|
| Max | 899 | 4114 |
| Average | 866 | 3996 |
| Deviation | 27.46 | 106.70 |
| Min | 828 | 3866 |
Sign up as Freemium to get more insight.