i3.xlarge by Amazon Web Services
Geekbench is a cross-platform processor benchmark with a scoring system that determines single-core and multi-core performance using loads simulating real-world scenarios. Geekbench 5 score is calculated with a reference score of 2500 representing the performance of the Intel Core i5-2520M @ 2.50 GHz. The software benchmark is available for Mac OS, Windows, Linux, Android and iOS platforms.
Specifications:
CPU
4
RAM
30.5 GB
Extra
1x
950 GB
NVMe SSD
Net
10000 Mbps
{
"configuration": {
"chart": {
"type": "scatter",
"polar": false,
"zoomType": "",
"options3d": {},
"height": null,
"width": null,
"margin": null,
"inverted": false,
"zooming": {}
},
"credits": {
"enabled": false
},
"title": {
"text": ""
},
"colorAxis": null,
"subtitle": {
"text": ""
},
"xAxis": {
"title": {
"text": [
"Single Score"
],
"useHTML": false,
"style": {
"color": "#666666"
}
},
"categories": null,
"lineWidth": 1,
"tickInterval": null,
"tickWidth": 1,
"tickLength": 10,
"tickPixelInterval": 100,
"plotLines": null,
"labels": {
"enabled": true,
"format": null,
"formatter": "",
"style": {
"color": "#666666",
"cursor": "default",
"fontSize": "11px"
},
"useHTML": false,
"step": 0
},
"plotBands": null,
"visible": true,
"floor": null,
"ceiling": null,
"type": "linear",
"min": 0,
"gridLineWidth": 1,
"gridLineColor": "#e6e6e6",
"minorTickInterval": null,
"minorTickWidth": 0,
"minTickInterval": null,
"startOnTick": true,
"endOnTick": true,
"tickmarkPlacement": 100,
"units": 100,
"minRange": 100
},
"yAxis": {
"title": {
"text": [
"Multi Score"
],
"useHTML": false,
"style": {
"color": "#666666"
}
},
"categories": null,
"plotLines": null,
"plotBands": null,
"lineWidth": null,
"tickInterval": null,
"tickLength": 10,
"floor": null,
"ceiling": null,
"gridLineInterpolation": null,
"gridLineWidth": 1,
"gridLineColor": "#e6e6e6",
"min": 0,
"max": null,
"minorTickInterval": null,
"minorTickWidth": 0,
"minTickInterval": null,
"startOnTick": true,
"endOnTick": true,
"minRange": null,
"type": "linear",
"tickmarkPlacement": null,
"labels": {
"enabled": true,
"formatter": null,
"style": {
"color": "#666666",
"cursor": "default",
"fontSize": "11px"
},
"useHTML": false
}
},
"zAxis": {
"title": {
"text": "Multi Score"
}
},
"plotOptions": {
"series": {
"dataLabels": {
"enabled": false,
"format": null,
"distance": 30,
"align": "center",
"inside": null,
"allowOverlap": false,
"style": {
"fontSize": "11px"
}
},
"showInLegend": null,
"turboThreshold": 0,
"stacking": "",
"groupPadding": 0.2,
"centerInCategory": false,
"findNearestPointBy": "x"
}
},
"navigator": {
"enabled": false
},
"scrollbar": {
"enabled": false
},
"rangeSelector": {
"enabled": false,
"inputEnabled": false
},
"legend": {
"enabled": null,
"maxHeight": null,
"align": "center",
"verticalAlign": "bottom",
"layout": "horizontal",
"width": null,
"margin": 12,
"reversed": false
},
"series": [
{
"name": "i3.xlarge by Amazon Web Services",
"color": "#f7981d",
"data": [
{
"x": 722.4205907010764,
"y": 1658.1846420232996
},
{
"x": 694.8525143250588,
"y": 1629.249988202486
},
{
"x": 729.0730623471409,
"y": 1689.43430226587
},
{
"x": 684.1148506741106,
"y": 1621.2847061726643
},
{
"x": 716.6155187254963,
"y": 1678.159243089197
},
{
"x": 688.9180254752468,
"y": 1624.722154792161
},
{
"x": 721.2189596429447,
"y": 1653.04430112855
},
{
"x": 683.9940922457284,
"y": 1607.4580998411893
},
{
"x": 699.0849117644735,
"y": 1647.2456537634948
},
{
"x": 679.2703116685457,
"y": 1617.5404606772809
},
{
"x": 733.0283375039722,
"y": 1701.3084702102424
},
{
"x": 732.2932266257069,
"y": 1696.2692409054107
},
{
"x": 740.9286394092306,
"y": 1702.8012671830234
},
{
"x": 732.8158970538306,
"y": 1702.9284429002098
},
{
"x": 744.4881671497234,
"y": 1699.4679884138695
},
{
"x": 729.275148718662,
"y": 1694.361368306591
},
{
"x": 744.6733563615526,
"y": 1698.915513880309
},
{
"x": 727.9793056112661,
"y": 1694.6633923228865
},
{
"x": 735.4387577443699,
"y": 1698.8124613457753
},
{
"x": 726.0503429431934,
"y": 1691.5641378335324
},
{
"x": 742.7151522058917,
"y": 1704.1958292375334
},
{
"x": 729.2430287659147,
"y": 1693.504458923208
},
{
"x": 743.8197329983266,
"y": 1699.6378698285403
},
{
"x": 728.4532579843863,
"y": 1686.6998930722652
},
{
"x": 734.0657985906566,
"y": 1701.613638345819
},
{
"x": 730.5510182842133,
"y": 1696.9542080633828
},
{
"x": 741.7626525867738,
"y": 1702.124263429066
},
{
"x": 734.6954538601188,
"y": 1696.449255612174
},
{
"x": 740.387156527942,
"y": 1699.7549509540017
},
{
"x": 721.6409186470194,
"y": 1699.1569828490374
}
]
}
],
"drilldown": {},
"tooltip": {
"enabled": true,
"useHTML": false,
"format": null,
"headerFormat": "",
"pointFormat": "<span style=\"color:{series.color}\">Single</span>: <b>{point.x:.0f}</b><br><span style=\"color:{series.color}\">Multi</span>: <b>{point.y:.0f}</b>",
"footerFormat": "",
"shared": false,
"outside": false,
"valueDecimals": null,
"split": false
},
"annotations": null
},
"hc_type": "chart",
"id": "289423755772676851423409724305493605531"
}
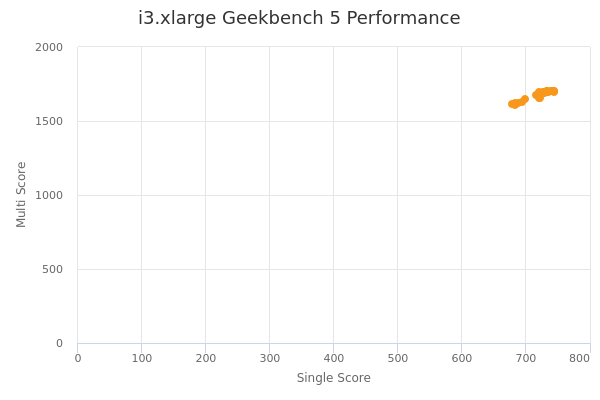
| Single | Multi | |
|---|---|---|
| Max | 745 | 1704 |
| Average | 724 | 1680 |
| Deviation | 19.29 | 30.27 |
| Min | 679 | 1607 |
Sign up as Freemium to get more insight.
- In same series
- i3.large
- i3.xlarge
- i3.2xlarge
- i3.4xlarge
- i3.8xlarge
- i3.16xlarge
- i3.metal