i3.large by Amazon Web Services
Geekbench is a cross-platform processor benchmark with a scoring system that determines single-core and multi-core performance using loads simulating real-world scenarios. Geekbench 5 score is calculated with a reference score of 2500 representing the performance of the Intel Core i5-2520M @ 2.50 GHz. The software benchmark is available for Mac OS, Windows, Linux, Android and iOS platforms.
Specifications:
CPU
2
RAM
15.2 GB
Extra
1x
475 GB
NVMe SSD
Net
10000 Mbps
{
"configuration": {
"chart": {
"type": "scatter",
"polar": false,
"zoomType": "",
"options3d": {},
"height": null,
"width": null,
"margin": null,
"inverted": false,
"zooming": {}
},
"credits": {
"enabled": false
},
"title": {
"text": ""
},
"colorAxis": null,
"subtitle": {
"text": ""
},
"xAxis": {
"title": {
"text": [
"Single Score"
],
"useHTML": false,
"style": {
"color": "#666666"
}
},
"categories": null,
"lineWidth": 1,
"tickInterval": null,
"tickWidth": 1,
"tickLength": 10,
"tickPixelInterval": 100,
"plotLines": null,
"labels": {
"enabled": true,
"format": null,
"formatter": "",
"style": {
"color": "#666666",
"cursor": "default",
"fontSize": "11px"
},
"useHTML": false,
"step": 0
},
"plotBands": null,
"visible": true,
"floor": null,
"ceiling": null,
"type": "linear",
"min": 0,
"gridLineWidth": 1,
"gridLineColor": "#e6e6e6",
"minorTickInterval": null,
"minorTickWidth": 0,
"minTickInterval": null,
"startOnTick": true,
"endOnTick": true,
"tickmarkPlacement": 100,
"units": 100,
"minRange": 100
},
"yAxis": {
"title": {
"text": [
"Multi Score"
],
"useHTML": false,
"style": {
"color": "#666666"
}
},
"categories": null,
"plotLines": null,
"plotBands": null,
"lineWidth": null,
"tickInterval": null,
"tickLength": 10,
"floor": null,
"ceiling": null,
"gridLineInterpolation": null,
"gridLineWidth": 1,
"gridLineColor": "#e6e6e6",
"min": 0,
"max": null,
"minorTickInterval": null,
"minorTickWidth": 0,
"minTickInterval": null,
"startOnTick": true,
"endOnTick": true,
"minRange": null,
"type": "linear",
"tickmarkPlacement": null,
"labels": {
"enabled": true,
"formatter": null,
"style": {
"color": "#666666",
"cursor": "default",
"fontSize": "11px"
},
"useHTML": false
}
},
"zAxis": {
"title": {
"text": "Multi Score"
}
},
"plotOptions": {
"series": {
"dataLabels": {
"enabled": false,
"format": null,
"distance": 30,
"align": "center",
"inside": null,
"allowOverlap": false,
"style": {
"fontSize": "11px"
}
},
"showInLegend": null,
"turboThreshold": 0,
"stacking": "",
"groupPadding": 0.2,
"centerInCategory": false,
"findNearestPointBy": "x"
}
},
"navigator": {
"enabled": false
},
"scrollbar": {
"enabled": false
},
"rangeSelector": {
"enabled": false,
"inputEnabled": false
},
"legend": {
"enabled": null,
"maxHeight": null,
"align": "center",
"verticalAlign": "bottom",
"layout": "horizontal",
"width": null,
"margin": 12,
"reversed": false
},
"series": [
{
"name": "i3.large by Amazon Web Services",
"color": "#f7981d",
"data": [
{
"x": 712.9034616737468,
"y": 841.8090964051261
},
{
"x": 691.1765230708511,
"y": 821.5045457077092
},
{
"x": 716.8027881871527,
"y": 841.1177443451654
},
{
"x": 701.3818748924602,
"y": 821.9791586120637
},
{
"x": 719.297773364445,
"y": 844.0086779967082
},
{
"x": 701.0885381765244,
"y": 820.4400424829796
},
{
"x": 718.5034566651997,
"y": 846.5300385008
},
{
"x": 699.0025458494405,
"y": 823.6143959534807
},
{
"x": 718.849580910634,
"y": 844.8068995592979
},
{
"x": 695.0743177580722,
"y": 821.4640283786719
},
{
"x": 723.9488997332261,
"y": 854.5068387476435
},
{
"x": 740.1114931368041,
"y": 869.1053434595947
},
{
"x": 740.6057686513184,
"y": 868.0503563168767
},
{
"x": 736.4090233554773,
"y": 856.8749394763072
},
{
"x": 745.5099808506436,
"y": 867.5580063633419
},
{
"x": 729.9853658382151,
"y": 857.1887032157636
},
{
"x": 744.3531743306502,
"y": 865.2123343493192
},
{
"x": 736.2461430392249,
"y": 860.3304190650674
},
{
"x": 741.5236403343422,
"y": 865.1844394893449
},
{
"x": 729.3546790657326,
"y": 858.1250055244961
},
{
"x": 740.762675842457,
"y": 866.5754472117308
},
{
"x": 727.2886272580052,
"y": 855.448755866871
},
{
"x": 737.1288790060441,
"y": 862.4859372371125
},
{
"x": 732.2622042693247,
"y": 858.0131778292512
},
{
"x": 743.3747946122886,
"y": 863.270351287393
},
{
"x": 733.4164154125621,
"y": 856.0448672530883
},
{
"x": 742.9491667477706,
"y": 868.3003825657322
},
{
"x": 734.3948665940918,
"y": 857.3298846628834
},
{
"x": 739.3839097131947,
"y": 868.9974616410256
},
{
"x": 727.5793922789973,
"y": 855.4479415485874
}
]
}
],
"drilldown": {},
"tooltip": {
"enabled": true,
"useHTML": false,
"format": null,
"headerFormat": "",
"pointFormat": "<span style=\"color:{series.color}\">Single</span>: <b>{point.x:.0f}</b><br><span style=\"color:{series.color}\">Multi</span>: <b>{point.y:.0f}</b>",
"footerFormat": "",
"shared": false,
"outside": false,
"valueDecimals": null,
"split": false
},
"annotations": null
},
"hc_type": "chart",
"id": "312559294420040454340059173329401635179"
}
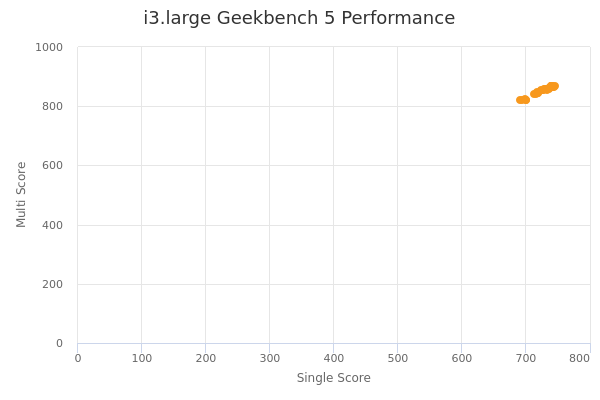
| Single | Multi | |
|---|---|---|
| Max | 746 | 869 |
| Average | 727 | 852 |
| Deviation | 15.72 | 15.65 |
| Min | 691 | 820 |
Sign up as Freemium to get more insight.
- In same series
- i3.large
- i3.xlarge
- i3.2xlarge
- i3.4xlarge
- i3.8xlarge
- i3.16xlarge
- i3.metal